

Austria entered the COVID-19 pandemic after a decade of almost uninterrupted residential property appreciation. The national House Price Index (HPI) rose from 100.0 in 2010 to 162.9 in 2019, supported by low financing costs, limited investment alternatives, demographic concentration in successful regions, and supply constraints in desirable locations [1]. The pandemic did not interrupt this trajectory. Instead, it simultaneously increased the utility of housing, expanded the demand for home-working capacity and outdoor space, and preserved strong investor interest during a period of exceptionally cheap credit.
The resulting market cannot be explained by a single “pandemic effect.” Two overlapping shocks shaped outcomes. The first was a preference and use-value shock: dwellings became workplaces, classrooms, recreation spaces, and perceived safe assets. The second was a capital-market shock: the euro area’s low-rate environment lowered debt service and increased the relative appeal of real property. After mid-2022, the second mechanism reversed rapidly as monetary policy tightened. The Austrian market, therefore, offers a useful case for examining how spatial preferences, financing conditions, supply rigidity, and asset illiquidity interact across successive regimes.
International evidence identifies a durable increase in hybrid work [2] and a pandemic-related reduction in the premium for central density in several markets [3, 4]. Urban models further predict that widespread home working can redistribute households and economic activity toward lower-density locations without eliminating the productivity advantages of cities [5]. German housing-market evidence similarly reported stronger search interest in gardens, terraces, and workrooms, alongside shifts in demand toward suburban and peripheral areas [6]. These studies establish plausible mechanisms, but they do not determine whether early relocation patterns persist once restrictions end and borrowing costs rise.
This study addresses three questions. First, how did prices, transactions, and estimated valuation risk differ across the pre-pandemic, pandemic, tightening, and recovery regimes? Second, which spatial changes persisted after mobility restrictions ended? Third, what do these changes imply for real estate portfolio management, project development, asset management, and regional planning? The study’s contribution is a longitudinal, management-oriented interpretation of official Austrian data through 2025. It introduces two analytical labels. The “space premium” describes the value attached to flexible floor area, outdoor access, and home-work capacity. The “liquidity-first correction” describes an illiquid asset-market adjustment in which turnover contracts much faster than prices. Together, these concepts help distinguish a durable change in housing attributes from a temporary one-way narrative of urban flight.
Remote work weakens the daily commuting constraint that traditionally capitalizes accessibility to central employment in land and housing prices. Evidence from the United States shows that work-from-home has stabilized well above its pre-pandemic level [2]. Housing research found corresponding shifts away from density and a relative revaluation of urban and suburban locations [3, 4]. The mechanism is not simply a preference for rurality. It is a reweighting of attributes: an additional room, an adaptable floor plan, a balcony, a garden, acoustic separation, broadband quality, and access to local services become more valuable when paid work is partly performed at home.
The distinction matters for planning. A household can seek the space premium in a city, a suburban municipality, or a rural settlement. The optimal location depends on commuting frequency, household composition, service access, transport costs, and dwelling prices. Accordingly, the observed market response may be polycentric rather than anti-urban. Cities can regain transaction share if they offer larger or more adaptable units, high-quality public spaces, and reduced commuting frequency. At the same time, detached-house markets remain structurally concentrated outside dense cores.
Contemporaneous Austrian survey evidence supports the attribute-based interpretation. In April 2020, 45% of employed respondents reported working from home; 28% of those workers had difficulty finding adequate space, rising to 42% among households in dwellings of no more than 60 square metres. One-fifth of respondents living in small dwellings became less satisfied with their dwelling size, and 74% of home workers wanted to continue working from home after the crisis [7]. The same survey found that 76% regarded rural living as advantageous during the crisis. These findings indicate a sharp early preference shock, although they cannot by themselves establish completed moves or long-run persistence.
Residential property combines consumption value, collateral value, and investment value. Lower interest rates increase borrowing capacity and reduce the discount rate applied to expected rental and resale income. In markets with slow permitting, scarce developable land, and long construction cycles, a demand shock can therefore be capitalized into prices before supply adjusts. Conversely, when borrowing costs rise, sellers may resist immediate nominal price reductions, while leveraged or affordability-constrained buyers withdraw. Market clearing then occurs first through fewer transactions, longer marketing periods, and greater negotiation rather than through a proportionate index decline.
This institutional friction motivates the concept of a liquidity-first correction. It predicts that turnover is a leading indicator of price weakness and recovery. It also predicts segment asymmetry. Existing dwellings may respond quickly to changes in household affordability. At the same time, new-build prices can remain comparatively rigid because developers face construction, energy, land, and financing costs that cannot be reduced without impairing project viability. The managerial implication is that annual price indices alone provide an incomplete risk signal.
Austria has a comparatively large limited-profit and social housing sector, extensive tenant protection, and regionally differentiated housing policy. These institutions have historically moderated some affordability pressures, but they do not remove the effects of rising purchase prices, land scarcity, construction costs, or unequal access to ownership. Pandemic-era social research showed that income losses and housing-cost stress were concentrated among unemployed and low-income households [8]. More recent OECD analysis concludes that Austria’s housing model continues to deliver relatively good aggregate outcomes. At the same time, affordability has deteriorated in major cities and supply, land-use, property-tax, and permitting reforms remain important [9].
For management and planning, the market must therefore be evaluated against three simultaneous objectives: financial resilience, spatial efficiency, and social affordability. A strategy that protects portfolio value by restricting supply may conflict with public goals. In contrast, a strategy that expands low-density construction without infrastructure and energy discipline may create long-run fiscal and environmental liabilities.
The study uses a longitudinal secondary-data design covering 2010–2025. The core dataset is the revised annual Austrian HPI published by Statistics Austria. The index is based on actual contract prices for residential property purchases by households. It applies a quality adjustment so that price changes are, as far as possible, separated from shifts in the characteristics of transacted dwellings [1]. The dataset distinguishes total residential property, new dwellings, existing dwellings, existing houses, and existing apartments.
Three complementary indicators were added. First, Statistics Austria transaction counts and transaction shares by degree of urbanization were used to separate price adjustment from market liquidity and to test whether spatial patterns persisted through 2025 [1]. Second, the historical main refinancing rate of the European Central Bank and Austrian household housing-loan rates were used to identify the monetary regime [10, 11]. Third, the Oesterreichische Nationalbank’s fundamentals indicator was used as an independent measure of the deviation of residential prices from values explained by selected fundamentals [11]. Financial-stability reporting was used to interpret the post-2022 lending environment and the expiration of Austria’s borrower-based KIM-V regulation in June 2025 [12].
The quantitative record was triangulated with the 2020 Austrian housing-preference survey [7], evidence on social impacts [8], and international peer-reviewed literature on remote work and spatial housing demand [2–6]. All sources are publicly accessible. No confidential, individual-level, or proprietary data were used.
Four regimes were defined ex ante from the timing of the pandemic and monetary-policy changes: (1) pre-pandemic expansion, 2010–2019; (2) pandemic and ultra-low-rate acceleration, 2019–2022; (3) monetary tightening and correction, 2022–2024; and (4) early recovery, 2024–2025. The ECB main refinancing rate remained at 0% from March 2016 until July 2022, rose to 4.50% by September 2023, and had declined to 2.15% by June 2025 [10]. Austrian average housing-loan rates moved from 1.2% in 2021 to 3.9% in both 2023 and 2024, before easing to approximately 3.4% during the first three quarters of 2025 [11].
For each regime, cumulative HPI change and compound annual growth rates were calculated. Annual segment spreads were used to compare new with existing dwellings and houses with apartments. Transaction-count changes were compared with price changes to identify the liquidity-first adjustment. Spatial persistence was assessed by measuring percentage-point changes in the shares of apartment and house transactions across densely populated cities, smaller cities, suburbs, and rural areas between 2021 and 2025.
The design is descriptive and does not claim causal identification. Pandemic restrictions, remote work, inflation, construction costs, the energy shock, the war in Ukraine, regulatory changes, income growth, and interest rates overlapped. Annual national indices also conceal variation among districts, price bands, energy classes, and household types. The 2020 preference survey captured intentions and immediate experience rather than verified relocation histories. The strength of the design lies instead in temporal extension, transparent calculations, use of revised official series, and triangulation across prices, transactions, financing, valuation, and stated preferences.
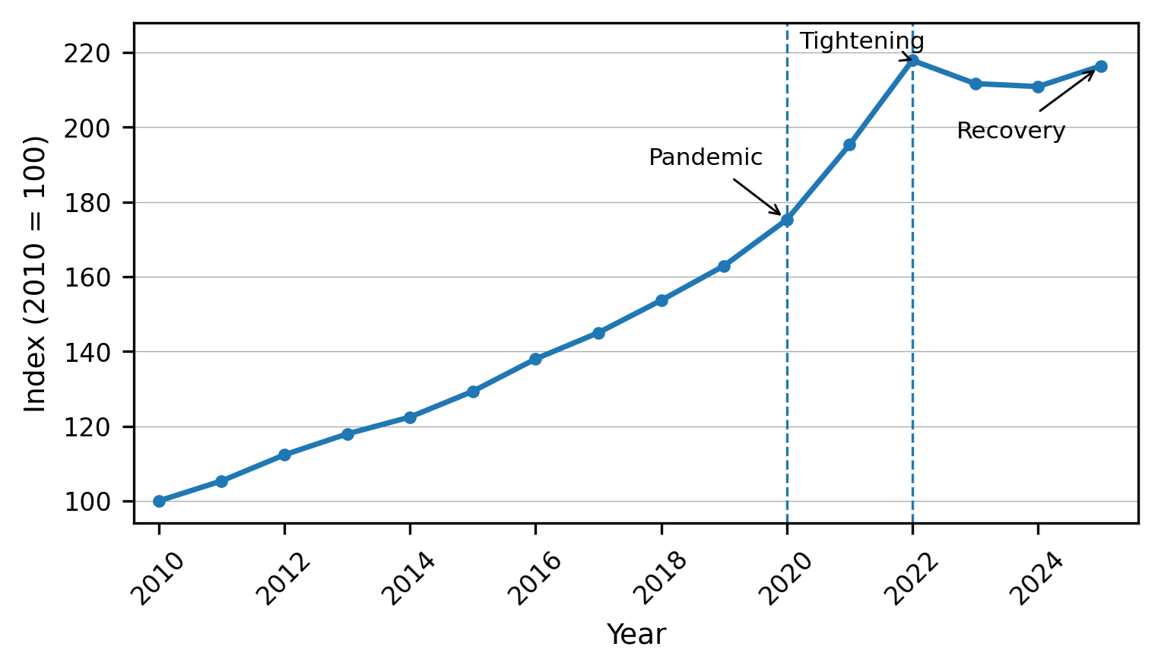
Figure 1 shows a continuous rise in the Austrian HPI from 2010 through 2022, followed by a shallow two-year correction and renewed growth in 2025. The index increased by 62.9% between 2010 and 2019, equivalent to a compound annual rate of 5.6%. Between 2019 and 2022, it rose by a further 33.8%, but the annualized rate accelerated to 10.2%. The pandemic-period growth rate was therefore approximately 1.8 times the pre-pandemic rate. This pattern rejects the proposition that the pandemic caused an immediate contraction in the residential market.
Table 1 decomposes the four regimes. The HPI peaked at 217.90 in 2022, declined to 210.88 in 2024, and recovered to 216.40 in 2025. The 2025 index stood only 0.7% below the 2022 peak. The modest peak-to-trough price decline contrasts strongly with the magnitude of the financing shock, indicating substantial nominal price stickiness.
| Regime | Period | Start HPI | End HPI | Cumulative change | CAGR |
|---|---|---|---|---|---|
| Pre-pandemic expansion | 2010–2019 | 100.00 | 162.91 | +62.9% | +5.6% |
| Pandemic acceleration | 2019–2022 | 162.91 | 217.90 | +33.8% | +10.2% |
| Tightening/correction | 2022–2024 | 217.90 | 210.88 | -3.2% | -1.6% |
| Early recovery | 2024–2025 | 210.88 | 216.40 | +2.6% | +2.6% |
| Note: CAGR = compound annual growth rate. Source: Author calculations from Statistics Austria [1]. | |||||
The composition of price growth changed with the regime. As Table 2 shows, existing dwellings rose by 13.1% in 2021, compared with 8.4% for new dwellings. Existing houses increased by 13.4% and existing apartments by 12.8%. In 2022, both new and existing dwellings rose by approximately 11.5%, while existing houses again outperformed apartments. The combination of immediate occupancy, constrained supply, low borrowing costs, and the demand for space supported the existing stock during the pandemic acceleration.
| Year | All dwellings | New | Existing | Existing houses | Existing apartments |
|---|---|---|---|---|---|
| 2020 | +7.6% | +7.5% | +7.7% | +8.6% | +6.8% |
| 2021 | +11.4% | +8.4% | +13.1% | +13.4% | +12.8% |
| 2022 | +11.6% | +11.5% | +11.6% | +13.7% | +9.9% |
| 2023 | -2.9% | -0.3% | -4.1% | -3.4% | -4.6% |
| 2024 | -0.4% | +2.5% | -1.6% | -2.1% | -1.2% |
| 2025 | +2.6% | +2.9% | +2.5% | +3.0% | +2.0% |
| Source: Latest revised annual HPI series published by Statistics Austria [1]. | |||||
The correction reversed the relationship. In 2023, existing dwelling prices fell by 4.1%, compared with only 0.3% for new dwellings. In 2024, new dwellings increased by 2.5%, while existing dwellings declined by 1.6%. This divergence is consistent with cost-based price rigidity in new construction and greater affordability sensitivity in the secondary market. In 2025, both segments returned to growth, with new dwellings rising by 2.9% and existing dwellings by 2.5%.
The house-apartment relationship also varied. Existing houses outperformed apartments in 2020, 2021, 2022, and 2025, but the differences were not large enough to support a simple claim that the pandemic permanently redirected the entire market toward detached housing. The more defensible result is that houses and space-intensive attributes received a temporary demand boost that interacted with persistent structural constraints.
Transactions moved earlier and more sharply than prices. Residential property purchases increased during the pandemic and then fell by approximately 27.6% in 2023. New-dwelling transactions declined by more than half, while existing-dwelling transactions fell by roughly one-fifth [1]. In the same year, the total HPI declined by only 2.9%. Thus, the quantity response was almost ten times the percentage magnitude of the price response.
The sequence continued during recovery. Transactions increased by 8.6% in 2024, even as the HPI declined by 0.4%. In 2025, transactions rose by 18.3% – the strongest annual increase in more than a decade – and the HPI increased by 2.6% [1]. Turnover, therefore, stabilized before the annual price index clearly recovered. This is the central evidence for a liquidity-first correction.
Financing indicators reinforce the interpretation. The sharp increase in housing-loan rates from 1.2% in 2021 to 3.9% in 2023 and 2024 reduced debt-financed purchasing capacity [11]. At the same time, the OeNB fundamentals indicator fell from an estimated 33.7% deviation in 2022 to 18.9% in 2023, 6.9% in 2024, and 4.7% in the third quarter of 2025 [11]. The normalization occurred through a combination of moderate nominal price adjustment, higher household incomes, lower transaction activity, and changing financing conditions rather than through a disorderly collapse.
This distinction is important for risk management. A portfolio can appear stable when assessed solely by appraisal values or annual price indices, even as its actual marketability has deteriorated substantially. Transaction volume, financing approvals, marketing time, bid-ask spreads, and cancellation rates should therefore be treated as leading indicators of portfolio liquidity and project absorption.
The early pandemic period produced clear evidence of greater rural interest. In 2020 and 2021, apartment transactions grew particularly strongly in thinly populated areas, consistent with survey findings on space, gardens, and home working [1, 7]. However, the distribution of completed transactions through 2025 reveals a more nuanced pattern.
Among apartment transactions, the share located in densely populated cities increased from 44.4% in 2021 to 49.0% in 2025. The rural share declined from 20.5% to 18.2%, and the share in smaller cities and suburbs declined from 35.1% to 32.8%. This re-urbanization indicates that the early rural apartment shift was not a permanent one-way exodus. The restoration of urban amenities, employment access, education, services, and the limited supply of apartments outside cities likely reasserted their influence after restrictions ended.
House transactions followed a different geography. Rural areas accounted for 52.7% of house transactions in 2021 and 54.4% in 2025. Dense cities accounted for less than 10% of the total. The detached-house market, therefore, remained structurally rural, with a small further increase in rural share. Table 3 summarizes these changes.
The combined result supports an attribute-based rather than location-deterministic interpretation. Demand for space, outdoor access, and home-work capacity persisted, but households did not uniformly abandon cities. Apartments re-concentrated in urban markets, while detached houses remained tied to rural and peri-urban land availability. The planning challenge is consequently to provide the desired attributes across a hierarchy of settlements rather than to assume that demand belongs exclusively to either the city or the countryside.
| Dwelling type / area | 2021 share | 2025 share | Change |
|---|---|---|---|
| Apartments – dense cities | 44.4% | 49.0% | +4.6 pp |
| Apartments – smaller cities/suburbs | 35.1% | 32.8% | -2.3 pp |
| Apartments – rural areas | 20.5% | 18.2% | -2.3 pp |
| Houses – dense cities | 9.2% | 8.8% | -0.4 pp |
| Houses – smaller cities/suburbs | 38.1% | 36.9% | -1.2 pp |
| Houses – rural areas | 52.7% | 54.4% | +1.7 pp |
| Note: pp = percentage points. Area classes follow the degree-of-urbanization categories reported by Statistics Austria. Source: Author calculations from Statistics Austria [1]. | |||
The Austrian evidence identifies two regime shifts. The first, from 2020 to 2022, combined a housing preference shock with abundant liquidity and very low interest rates. The home became a multipurpose asset serving both productive and consumption functions, while borrowing remained inexpensive. In a supply-constrained market, this combination accelerated price growth beyond the previous decade’s already strong trend. The result is consistent with international findings on remote work, reduced density premiums, and the revaluation of urban space [2–5].
The second shift began when monetary tightening raised the cost of debt. Financing conditions then dominated the short-run expression of the space premium. Households could still prefer larger or better-equipped dwellings, but were less able to purchase them. Because sellers and developers were reluctant or unable to reduce prices proportionately, turnover absorbed most of the initial adjustment. This explains why transaction volumes collapsed in 2023 while the national price index declined only moderately.
The study, therefore, refines three common narratives. First, the pandemic was not an isolated cause of price inflation; it amplified a low-rate, supply-constrained trajectory. Second, “urban flight” was real as an early preference and transaction impulse, but it did not become a permanent, uniform redistribution of all housing demand. Apartment activity moved back toward dense cities by 2025, while the rural orientation of houses persisted. Third, price resilience should not be confused with market resilience. An illiquid asset can retain an indexed value while becoming difficult to sell, refinance, or develop profitably.
The results also expose a distributional tension. Higher-income households and investors were better positioned to capitalize on the space premium. In contrast, households facing income loss or high rent burdens had less ability to improve their housing situation [8]. By 2025, lower interest rates and renewed transaction growth improved market activity, but affordability remained constrained by the cumulative price increase, construction costs, and unequal wealth. The OECD’s recommendation to improve land use, permitting, limited-profit supply, property taxation, and energy efficiency is therefore compatible with the market evidence [9]. Supply and planning reform must address both quantity and the type of dwelling produced.
The analysis remains subject to the limitations of a noncausal design and aggregation. Nevertheless, the consistency across price, transaction, interest rates, valuation, survey, and international evidence makes the regime interpretation more persuasive than a single-period comparison. Future microdata research should estimate how energy performance, dwelling size, outdoor space, broadband, distance to employment, and district-level accessibility were capitalized before and after the rate shock.
Traditional real estate development and portfolio management emphasize the joint assessment of return, liquidity, location, and risk [13–15]. The Austrian regime shifts show that these dimensions must be monitored dynamically rather than through a single base-case yield. Table 4 translates the evidence into four decision domains.
| Decision domain | Market evidence | Recommended response |
|---|---|---|
| Portfolio management | Transactions moved before prices; financing costs changed rapidly. | Track liquidity indicators; stress-test debt service, refinancing, vacancy, and exit values; diversify by location, type, tenant profile, and energy class. |
| Development management | Space attributes remained valuable, but apartment activity re-urbanized, and new-build liquidity weakened. | Use adaptable layouts and outdoor/shared space; phase projects; apply conservative absorption and pre-sale assumptions; avoid undifferentiated peripheral supply. |
| Asset/property management | Energy and operating costs became more material after 2022; existing assets showed greater price sensitivity. | Prioritize energy retrofits, predictable service charges, broadband, and adaptable use; integrate capital expenditure into valuation and rent strategy. |
| Regional planning | Fewer commuting days widened the feasible residential choice, but cities regained apartment share, while houses remained rural. | Support compact polycentric nodes with transit, broadband, schools, health services, and mixed uses; improve adaptable urban housing and prevent infrastructure-intensive sprawl. |
| Source: Synthesis of the empirical results and real estate management principles [13–15] | ||
Portfolio management should use transaction liquidity as an early warning signal. Annual appraisals should be supplemented by local turnover, marketing time, financing availability, price reductions, vacancy, tenant affordability, and refinancing schedules. Stress tests should model at least a high-rate case, a weak-income case, and a construction-cost case. Leverage should be evaluated against cash-flow coverage rather than expected capital appreciation. Diversification should include geography, dwelling type, tenant profile, and energy performance, because each segment reacted differently across regimes.
Development management should avoid interpreting the space premium as a mandate for indiscriminate low-density expansion. Projects are more defensible when they deliver adaptable layouts, daylight, acoustic separation, balconies or shared outdoor space, broadband readiness, and proximity to public transport and daily services. In urban apartments, flexible internal planning can reproduce part of the space premium without excessive floor area. In suburban and rural projects, phasing, pre-sales, conservative absorption assumptions, and full life-cycle infrastructure costs are essential. New-build price rigidity does not guarantee sales liquidity.
Asset and property management should prioritize energy retrofits and adaptable use. The post-2022 energy and financing shocks increased the operational relevance of insulation, heating systems, metering, and predictable service charges. Poor energy performance can result in a double discount through higher occupancy costs and future capital expenditures. Existing houses in peripheral locations require especially careful evaluation because energy, mobility, ageing, and resale risks can accumulate even when land and space are attractive.
Regional planning should favor polycentric accessibility. The durable lesson is not that every household will move to the countryside, but that fewer commuting days increase the feasible residential radius. Municipalities can convert this flexibility into resilient development only when broadband, public transport, schools, health services, local workspaces, and compact settlement patterns are coordinated. Unmanaged dispersion would transfer private demand into public infrastructure costs, car dependence, land consumption, and emissions. City policy, meanwhile, should preserve the apartment market’s renewed attractiveness by improving public space, family-sized and adaptable housing, mixed-use services, and affordability.
Austria’s residential market moved through a pandemic acceleration, a monetary correction, and an early recovery without experiencing a large nominal price collapse. The 2019–2022 HPI growth rate nearly doubled the pre-pandemic annual pace, confirming that the pandemic amplified rather than interrupted the housing boom. When interest rates rose, transaction volume adjusted far more strongly than price, producing a liquidity-first correction. By 2025, both turnover and prices had returned to growth, while the national index remained close to its 2022 peak.
Spatially, the evidence rejects a permanent, universal urban exodus thesis. Apartment transactions re-concentrated in dense cities after the early rural surge, while detached houses remained predominantly rural. The durable change is better described as a space premium attached to flexibility, outdoor access, and home-work capacity across locations.
For investors and managers, the principal lesson is to separate value from liquidity and to stress-test financing, absorption, and energy costs. For planners, the appropriate response is polycentric and infrastructure-led: adaptable urban housing, compact service-rich suburban nodes, and selective rural development rather than uncoordinated sprawl. The Austrian case demonstrates that housing strategy must be designed for interacting preferences, monetary, supply, and equity regimes rather than extrapolated from a single crisis year.
All authors contributed equally to the conception, development, analysis, interpretation, and preparation of the manuscript. All authors critically reviewed the manuscript, approved the final version, and accept responsibility for the integrity of the work.
The authors acknowledge the publicly accessible institutions and data providers whose statistical series, reports, and survey materials supported the analysis presented in this study.
This research received no specific grant from any funding agency in the public, commercial, or not-for-profit sectors.
The authors declare that they have no conflicts of interest or competing interests that could have influenced the work reported in this manuscript.
All data used in this analysis are publicly available from the sources cited in the manuscript. The calculations reported in the tables were derived from those published statistical series. Additional information concerning the calculations may be obtained from the corresponding author upon reasonable request.
This study used published aggregate statistics, published survey results, and openly accessible reports. It involved no direct recruitment of human participants, no intervention involving human subjects, and no access to identifiable personal data. Accordingly, institutional ethical approval and informed consent were not required.
OpenAI ChatGPT (GPT-5.5 Pro) was used to assist with English-language drafting, structural organization, and consistency checking. All empirical data, calculations, interpretations, citations, and references were independently checked against the cited sources by the authors. The authors take full responsibility for the accuracy and integrity of the submitted manuscript. No generative AI tool was used to create, modify, or fabricate empirical data.