

Today, urban transport systems have evolved beyond being merely technical services that facilitate the movement of individuals from one point to another; they have become a multi-dimensional field of planning that integrates objectives such as environmental sustainability, energy efficiency, social accessibility, road safety and economic efficiency. A growing population, rapid urbanisation, the rise in motor vehicle use and the concentration of transport demand have brought issues such as traffic congestion, fossil fuel consumption, carbon emissions, air pollution and a decline in quality of life into sharper focus. Consequently, modern transport policies are shifting towards sustainable approaches that reduce private vehicle use, strengthen public transport, promote low-emission transport models, and support transport infrastructure with digital technologies.
Sustainable transport aims to provide transport services in a safe, accessible, efficient and environmentally sensitive manner, taking into account the environmental, economic and social needs of both current and future generations. The aim of this strategy is to raise not only the capacity of their transport systems, but also their social, environmental and use of resources efficiencies. According to Pojani and Stead [1], sustainable urban transport is not only the challenge of big cities, especially in developing cities, but is a policy area in need of integrated management in all settlements undergoing urbanization pressures. According to Guerrero-Ibáñez et al. [2], deploying sensor technologies and digital infrastructure in transport systems can assist in achieving sustainability. One of the most important components of sustainable urban mobility is public transport systems. The public transport system is strategically important for reducing dependence on private motor vehicles to cut fuel cost, carbon emission, and regulation of traffic in a more equitable way. Xia et al. [3] indicated that the substitution of car trips for other modes of travel generates beneficial effects on air pollutants, energy use and public health. Public transport system has mitigation effect on carbon emissions in Jiang et al. [4] when they conducted a panel quantile regression analysis for Chinese provinces. In addition, energy consumption is not related directly here. These findings show that public transport systems are an essential policy tool, not only for transportation services but also for environmental sustainability purposes. In this sense, the Intelligent Transportation Systems (ITS) offer essential technological facilities that make urban transportation safer, more efficient, more accessible, and more environmentally friendly. Intelligent Transportation Systems (ITS) is a novel approach to transportation management that results from the use of information and communication technologies, sensor networks, communication protocols, artificial intelligence, big data analytics real-time monitoring systems and computer vision methods embedded in the transportation infrastructure. According to Alam et al. [5], ITS has a proven track record of enhancing the speed, accuracy and safety of transport planning routine as per its components of sensors, communication infrastructure, data management and artificial intelligence. Kocalar [6], on the other hand, states that in the post-Industry 4.0 era, artificial intelligence, IoT, big data, and computer vision technologies have made ITS applications more functional.
One of the most significant contributions AUS makes to urban transportation is the ability to manage transportation systems based on real-time data. Thanks to real-time traffic information, dynamic route suggestions, smart intersection systems, smart ticketing, incident management, in-vehicle information systems, public transit tracking, and passenger information applications, both passengers and transit operators are able to make more informed decisions. Brakewood and Watkins [7] note that real-time public transportation information systems improve passengers’ decision-making processes and can encourage the use of public transportation. Lv and Shang [8], meanwhile, emphasize that ITS applications contribute to reducing fuel consumption and emissions by alleviating traffic congestion.
In the national policy papers of Turkey, there is also a place for smart transportation and sustainable mobility topics. Under the National Smart Cities Strategy and Action Plan 2020–2023; developing smart transportation and mobility systems, supporting low-emission transport models and promoting green transport approaches widely, has been targeted as part of this initiative. According to Akbulut [9], urban sustainable planning and management of public transport services require integrated public transport systems, continuity of policies and compliance with access principles. Smart transportation technologies can provide an effective use of resources. They can help in campus and urban transportation planning [10]. The passenger density in public transport system should be monitored accurately, continuously and in real-time to enhance efficiency. Specifically, the volume of passengers queuing at bus stops, on-board occupancy rates, boarding and alighting movements as well as crowd levels during peak hours are crucial data for the planning of service frequency and capacity. Conventional planning approaches create schedules on the basis of historical data, fixed time intervals, or estimated values of demand. However, today image processing and AI based systems enable development of dynamic real-time decision-support systems. Passenger counting, crowd monitoring and density detection through computer vision are core components of modern public transport systems in this light.
The computer vision technologies are used in many areas of AUS such as vehicle detection, license plate detection, traffic sign detection, pedestrian detection, lane detection, incident detection, passenger counting and crowd monitoring. According to Loce et al. [11], Systems for traffic monitoring and decision-support are essential technologies for the system-of-systems road transport system. Dilek and Dener [12] have shown that computer vision is largely applied in ITS by using it for passenger counting, density detection, vehicle motion analysis, monitoring of traffic violation and driver assistance systems. From classical image processing techniques to deep learning based object detection models such as CNN, LSTM and YOLO-based approaches have been the leading methods for passenger detection and density analysis studies. Monitoring the number of passengers in public transport systems is essential to ensure the operational efficiency of the vehicle as well as to ensure comfort, safety, and satisfaction of passengers. As per Tirachini et al. [13], overcrowding in public transportation creates negative effects on passengers in the form of stress, anxiety, fatigue, invasion of privacy and diminishing comfort. Moreover, high passenger density hampers the flow of movement within vehicles, resulting in prolonged travel and waiting times. This worsens service reliability and the public’s image of public transport. Consequently, the need for real-time passenger density information is critical for enhancing service quality as well as re-adjusting the supply of public transport relative to the demand.
The main objective of this study is to develop and evaluate a deep learning-based passenger density estimation framework that can be used as a decision-support component in future public transportation systems. The study does not only focus on detecting head regions in bus stop images; rather, it investigates how camera-based passenger density information can be transformed into an operational input for demand-responsive service planning, capacity management, and smart bus stop applications. In this context, the proposed approach aims to support real-time monitoring of stop-level passenger demand and to provide a data-driven basis for decisions such as adjusting service frequency, dispatching additional vehicles, identifying peak-demand periods, and improving passenger-oriented public transport operations.
The main contributions of this study are as follows:
Studies on sustainable transport discuss the environmental, economic, and social impacts of urban mobility together. Transportation systems need to examine not just evaluation of speed and capacity but also energy consumption, carbon footprint, accessibility, safety, social equity, and quality of life. According to Pojani and Stead [1], sustainable transportation in developing cities must address planning, infrastructures, use of public transit and social accessibility. Guerrero-Ibáñez et al. [2] emphasize the importance of sensor technologies in AUS, linking data-driven transport management to sustainability objectives. To decrease greenhouse gas (GHG) emissions, air pollution and energy consumption, the most effective method is curbing the use of private vehicles and enhancing public transport use. According to Xia et al. [3], replacing car journeys with other means of transport, primarily public transport, walking and cycling, leads to an environmental and public health win-win. The research states that a decrease in car use has a positive impact on carbon footprint and health threats. In quantile regression analysis based on a panel data set for the 30 provinces of China for the 2000-2015 period looking at the relationship between carbon emission and public transport system Jiang et al. [4] showed that public transport has higher environmental impacts in places with low and medium emissions. Moreover, it appears that energy consumption becomes another intermediary variable in this relationship.
The steps that are taken in Turkey for sustainable transportation policies cover headings such as the expansion of public transportation, support for low-emission vehicles, bicycle and pedestrian path development, smart bus stop systems, real-time passenger information applications, and the integration of different transportation modes. According to Akbulut [9], those in charge of urban transportation services should make sustainable policy recommendations. According to Fidan et al [14], a research carried out on sustainable smart transportation management via Bursa shows that AUS applications may improve the management of urban mobility. The smart transportation and mobility applications are also included among Turkey’s urban transformation objectives in National Smart Cities Strategy and Action Plan 2020–2023 prepared by Ministry of Environment and Urbanization Republic of Turkey [15].
The Intelligent Transportation Systems (ITS) make use of an integrated system of telecom technologies for its functions. These systems have been developed for achieving efficient traffic management. It improves road safety, travel efficiency, and quality of public transport systems. In addition, the system also enhances user information services. It incorporates the use of technologies for telecom and information on road infrastructure. ITS encompasses the digital optimization of vehicles but also of roads, signalization, public transport, passengers, tolling, emergency management, and many other things. The authors Alam et al. [5] state that ITS is an integration of sensor networks, communication protocols, database management, and AI systems. According to Auer et al. [16], ITS saw its origin in the USA when a project was undertaken with the objective of eliminating traffic congestion. Consequently, such systems have gained wide proliferation in regions like Japan, European Union Member States and South Korea. AUS’s key features include real-time data usage, an integrated architecture, user-focused service, security, sustainability, and decision-support features. Du and Dao [17] discussed the issue of delays during information propagation in vehicle-to-vehicle communication networks. Such communication will help traffic to flow smoothly and prevent accidents. Benevolo et al. [18] evaluated the concept of smart mobility as one of the core components of smart cities and emphasized that the digitalization of transportation services holds strategic importance for urban management. Kocalar [6] conducted a system analysis for AUS within the scope of smart city logistics and stated that AUS is a transformation area based on artificial intelligence, IoT, big data, and integration.
The application areas of AUS include advanced traffic management systems, advanced travel information systems, advanced public transportation systems, smart intersections, smart tolling, in-vehicle information systems, emergency management, incident detection, route optimization, and real-time passenger information applications. These systems enable two-way information exchange between vehicles, road infrastructure, and passengers, making traffic flow more orderly, safe, and predictable. Smart intersections, smart bus stops, and real-time public transportation information systems used in major cities such as Istanbul, Ankara, and Bursa in Turkey are considered local application examples of AUS.
Demand-responsive public transport planning refers to the adaptive organization of public transport services according to actual or predicted passenger demand rather than relying only on fixed timetables. In conventional public transport systems, service frequency is generally determined based on historical passenger data, pre-defined schedules, or average demand assumptions. Although such planning approaches are operationally simple, they may not respond effectively to short-term changes in passenger demand at specific stops, especially during peak hours, special events, weather-related disruptions, or unexpected crowd formation.
In public transport systems of the future, operational decisions will be taken based on real-time demand information. The provision of real-time public transport information helps passengers to make informed decisions and might enhance the efficiency of public transport services [7]. Similarly, intelligent transport systems have an integrated technological basis for collecting, processing and using real time transport data for operational management [5]. In this context, stop-level passenger density data can provide transport operators with a direct assessment of where and when passengers build up.
Passenger density information can support decisions such as increasing service frequency, dispatching additional vehicles, allocating higher-capacity buses, revising timetables, or optimizing low-demand service intervals. Previous studies have emphasized that crowding in public transport negatively affects passenger comfort, perceived service quality, movement inside vehicles, and waiting or travel time reliability [13]. Therefore, the ability to monitor passenger accumulation at stops is important not only for operational efficiency but also for passenger-oriented mobility.
Smart bus stops can serve as active sensing points in demand-responsive transit systems. When equipped with cameras, edge devices, communication modules, and passenger information systems, bus stops can provide real-time information about waiting passengers. Such data can be transferred to public transport operation centres and integrated with automatic vehicle location systems, timetable management platforms, and route planning modules. The use of sensor technologies in intelligent transportation systems has been identified as an important component of data-driven and sustainable transport management [2].
The significance of real-time passenger density information for enhancing service quality and capacity management cannot be overstated. When there are more passengers than the bus can take, it indicates low service frequency. Further, if the bus is full, it suggests a queuing issue. And there must be a short designated waiting time. On the other side, repeated observations with low density may indicate service interval inefficiency or excessive vehicles. Research in dynamic scheduling has shown that passenger demand information can be used to guide bus timetable decisions to reduce waiting time [19]. Demand-sensitive planning helps improve efficiency in urban bus operations, as demonstrated by optimization-based approaches [20]. The current study attempted to fill the operational demand knowledge gap by proposing a deep learning-based passenger density estimation framework that can transform bus stop images into operational demand information for modern public transport systems.
Computer vision is one of the core fields of artificial intelligence that supports automated decision-making processes by extracting meaningful information from digital image and video data. In the context of AUS, computer vision is used in many areas such as vehicle detection, vehicle classification, license plate recognition, traffic sign detection, pedestrian detection, lane tracking, incident detection, passenger counting, crowd monitoring, and driver assistance systems. Loce et al. [11] noted that computer vision applications are a significant technology in terms of monitoring, detection, and traffic management within road transportation systems. Dilek and Dener [12], through a comprehensive examination of computer vision applications within AUS, have demonstrated that these technologies are most frequently used in passenger counting, density detection, vehicle motion analysis, monitoring of traffic violations, and driver assistance systems.
Computer vision methods have evolved over time from classical image processing techniques to deep learning-based approaches. Early studies utilized methods such as edge detection, colour clustering, moving object tracking, and hand-crafted feature extraction; during the classification phase, machine learning algorithms such as SVM, k-NN, and decision trees were employed. In recent years, object detection models based on Deep Neural Networks, Convolutional Neural Networks, Long Short-Term Memory (LSTM) networks, and YOLO have gained widespread adoption. While CNN-based models demonstrate high performance in automatically detecting and classifying objects in images, LSTM and RNN-based models are used to analyse time-dependent motion and traffic flow patterns.
In advanced AUS applications, computer vision systems can work in conjunction with radar, lidar, magnetic sensors, IoT-based devices, and communication systems. Kamble et al. [21] note that the combined use of computer vision and sensor networks is crucial for multi-layered data collection, contextual analysis, and real-time decision support in traffic management. This approach is particularly prominent in environments where safety and service quality are critical, such as smart intersections, tunnel monitoring systems, crowd management, bus stops, and public transportation vehicles.
Advanced Public Transportation Systems encompass intelligent transportation components developed for the planning, monitoring, routing, and efficient management of high-capacity public transportation vehicles such as buses, metrobus, trains, and similar modes. Figueiredo et al. [22] note that public transportation, traffic management, and travel information systems must be considered together in the development of intelligent transportation systems. APTS applications include functions such as vehicle location tracking, passenger density estimation, route optimization, real-time travel information, in-vehicle information, and operational management.
Smart bus stop systems provide passengers with real-time information such as bus arrival times, route information, traffic conditions, vehicle occupancy rates, and alternative transportation options. Yavuz [23] on Using the Example of Istanbul in Smart Cities. Furthermore, smart bus stops in terms of passenger information, waiting time reduction, and increasing confidence in public transport are highly important. Smart bus stops are not just passive information providers for the passengers, they are also an active data source that can monitor the density of stops, number of waiting passengers, and change in demand. Crowd monitoring systems are extremely necessary for security purposes and to maintain service quality on public transport vehicles, at stops, terminals and stations. Saleh et al. [24] have reviewed research works on crowd density estimation/people counting from visual surveillance system; they mentioned that crowd management is vital for security, emergency response, and service/demand estimation. Crowd monitoring systems can detect excessive crowding, stampedes, and emergency risks. Passengers can then be redirected to alternative stops or routes. With the help of these systems, density maps can be generated which help in planning service frequency and vehicle capacity. Passenger density impact is not restricted to operation level. According to Tirachini et al. [13], crowding in public transport causes a wide range of psychological and sociological effects on passengers, like stress, anxiety, fatigue, loss of privacy, and decreased comfort. Crowding impedes movement in vehicles and increases time spent boarding and alighting. These contribute to unreliable travel times. Due to this reason, system of crowd monitoring and passenger counting is equally necessary for capacity as well as satisfaction and service quality.
Automatic passenger counting in public transport is one of the basic data sources for route planning and capacity management as well as energy efficiency and passenger satisfaction. In their 2007 study, Roqueiro and Petrushin [25] showed that people can be counted using video cameras and pointed out visual systems have a future for counting passengers. According to Lengvenis et al. [26], the utilization of computer vision systems for passenger counting in public transportation seems feasible. The authors noted that camera-based systems can be utilized for the analysis of alighting and boarding movements. Hsu et al. 2020 [27] developed a deep learning-based method to estimate the number of people on the bus. Video data from in-bus surveillance cameras were used and passenger density was estimated using CNN-based visual feature extraction and regression modelling. The model results were consistent irrespective of the denser or the traffic and could track passengers without human intervention. As per the findings of this study, the data generated by CCTV cameras of buses can also be used for capacity management and route planning by authorities. Khan et al. [28] suggested the use of an experimental model based on image processing techniques to accurately detect and count passengers in any public transport. Algorithms for moving object detection were investigated using different in-bus image datasets for people counting. As evidenced by the results, the system is able to achieve over 90% accuracy. According to this finding, passenger counting through image processing is possible despite the limitations of camera quality, lighting, image resolution, etc. in real field conditions.
Developed by Lin et al. [29], this system detects the presence of passengers and recognizes their behaviour. The study employed YOLOv5 for object detection and LSTM-based action recognition on images acquired from in-vehicle cameras. With 93% accuracy, the system detected the number of passengers and successfully classified standing, sitting and boarding/alighting actions. The research reveals that it is not only possible to analyse passenger behaviour (beyond passenger counting) but also that this information can be assessed in terms of security, occupation and quality of service. A team of investigators known as Radovan 2024 [30] considered existing options on passenger counting systems in public transport. Various options were compared by the team in this technology. The authors have also put forth an image processing-based solution in which the images captured by cameras at the stops are processed through the YOLOv5 architecture. According to the test results, the solution resolves passengers counting in crowded environments, and it is more accurate than conventional sensor-based solutions. It is an important study for stop-based passenger density monitoring systems. Martínez [31] developed a system using YOLO, trained with Python and OpenCV to detect passenger density inside buses. The study shows that while detection of the passenger head is done from video streams, the system has been tested under different light conditions and got up to (90%) accuracy. This method provides a valuable computer vision solution for monitoring in-vehicle density and optimizing routes in real-time. The authors designed a YOLOv8-based system for real-time passenger counting on public transportation buses. The model trained on heads of the passenger inside a bus for passenger counting and it showed 91.4% accuracy in experiments using real-world data with high passenger density. The outcome proves that current object detection architecture for instance YOLOv8 would benefit public transport capacity planning and passenger density monitoring.
Monitoring and informing counting and congestion detection can be utilized not only for monitoring but also for scheduling and optimizing resource utilization. In the conventional public transport planning approach, service intervals are determined based on fixed timetables. However, real-time data on passenger density can be used to plan demand-responsive and flexible services. It helps lower waits in peak hours, helps avoid useless trips in off-peak hours, and helps harmonize vehicle utilization rates. Ai and others, in the year 2021 [19], presented a deep reinforcement learning-based approach for real-time bus scheduling based on passenger density. This simulation-based study used online passenger information to dynamically reshape the route schedule. The study found that the system could reduce the passenger waiting time by 20% and balance the vehicle utilization rates. Results of this research reflect that public transportation operations may be directly improved with the help of AI-supported optimization methods. Polat and others [20] argued about the schedule optimization of urban bus routes within the framework of sustainable transport planning. The study used actual bus data for generating the bus schedules using linear programming. The model adjusted trip intervals based on passenger demand and reduced empty trips during off-peak and low-demand hours. According to the authors, this optimization lowered operational costs and increased passenger satisfaction. Passenger density data can therefore be directly used in the planning of sustainable public transportation. Passenger volume data incorporation into route optimization is also essential with a view to environmental sustainability. Decreasing unnecessary trips lowers fuel consumption and carbon emissions, while ensuring adequate capacity at times of peak demand makes public transport even more attractive. This method will allow savings for transport operators and also engage in eco-friendly transport efforts at the city level.
A review of the literature shows that computer vision and deep learning methods have been widely used for passenger counting, pedestrian detection, crowd monitoring, and public transport occupancy estimation. Early camera-based approaches demonstrated the feasibility of passenger counting and people counting using video or image data [25, 26]. More recent studies have used deep learning-based methods to estimate passenger numbers in buses or public transport environments [27, 28]. These studies indicate that camera-based systems can provide useful data for public transport monitoring and capacity management.
Recent works have also shown that YOLO-based and deep learning-based systems can be used for passenger detection, passenger counting, and passenger behaviour analysis in public transport vehicles and related environments [29, 30, 32]. In addition, broader reviews of computer vision applications in intelligent transportation systems indicate that passenger counting, density detection, vehicle detection, and traffic monitoring are among the major application areas of computer vision in transport systems [12]. These studies demonstrate that computer vision has become a technically mature approach for extracting operational information from transport environments.
However, an important limitation in the existing literature is that passenger detection outputs are often evaluated mainly as technical computer vision results. In many studies, the detected number of people is not sufficiently transformed into an operational decision-support variable for public transport planning. In particular, bus stop-level passenger density remains an important but underutilized data source for demand-responsive public transport operations. Real-time knowledge of how many passengers are waiting at a stop can support decisions related to service frequency adjustment, additional vehicle dispatching, capacity balancing, timetable revision, and passenger information services.
There is another gap in the research regarding smart bus stop monitoring for future public transport systems. According to Alam et al. [5] and Guerrero-Ibáñez et al. [2], real-time data, communication infrastructure, sensors and AI increasingly characterise intelligent transport systems to support traffic and public transport control. Yet the planning of most public transport continues to depend on fixed timetables and historical demand. A gap now exists between the sensing capability and transport management function. A system that employs cameras to estimate passenger density at the stop level can help bridge this divide by offering public transport operators actionable information that is precise, real-time, and location-specific. The current research gap will be addressed with a proposal for passenger density estimation framework using deep learning for bus stops. The research does not treat head detection only as a problem of object detection. The pre-processed information lets us derive several passenger attributes, but we will restrict ourselves to the passenger density indicator in our case study. In this way, the proposed framework links computer vision-based passenger detection with future public transportation operations, capacity management, and data-driven decision support.
In this study, a camera-based passenger density estimation framework was designed for future public transportation systems. The structure proposed has two constituent parts. The first layer within the system is the computer vision layer. This was designed to detect the head regions of passengers who are waiting for the bus at the bus stops. Deep learning-based object detection model was used for detecting the head regions of the passengers. The second stratum is the transport decision-support layer, where the headcount detected is interpreted as a stop-level passenger density indicator. The study’s general workflow encompasses image acquisition, preprocessing, conducting head-region annotations, model training, passenger counting based on object detection, density classification and operational interpretation. According to this approach, the output of the detection model would not be regarded merely as a technical object detection result. The head count that was detected, in turn, is converted to an operational variable supportive of demand-responsive service planning, capacity management and smart bus stop monitoring. This design is paramount to future public transport systems as the stop-level passenger demand in real-time can help the operators move beyond static timetable based planning and engage towards more adaptive, data driven and passenger-oriented service management.
The dataset used in this study was created from an open-access image dataset based on “Face Detection” available on the Roboflow platform. The dataset consists of a total of 1,558 images, each with a resolution of 640\(\times\)640 pixels. The data was divided into training, validation, and test sets. Accordingly, 75% of the images were used for training, 15% for validation, and 10% for testing. The training set contains 1,169 images, the validation set contains 234 images, and the test set contains 155 images.
This data structure has enabled the model to be evaluated in a balanced manner during the training, validation, and independent testing phases. While the training set is used to learn the model parameters, the validation set is used to monitor model performance during the training process and to assess the tendency toward overfitting. The test set, on the other hand, is set aside to evaluate the model’s overall performance on images it has not seen before.
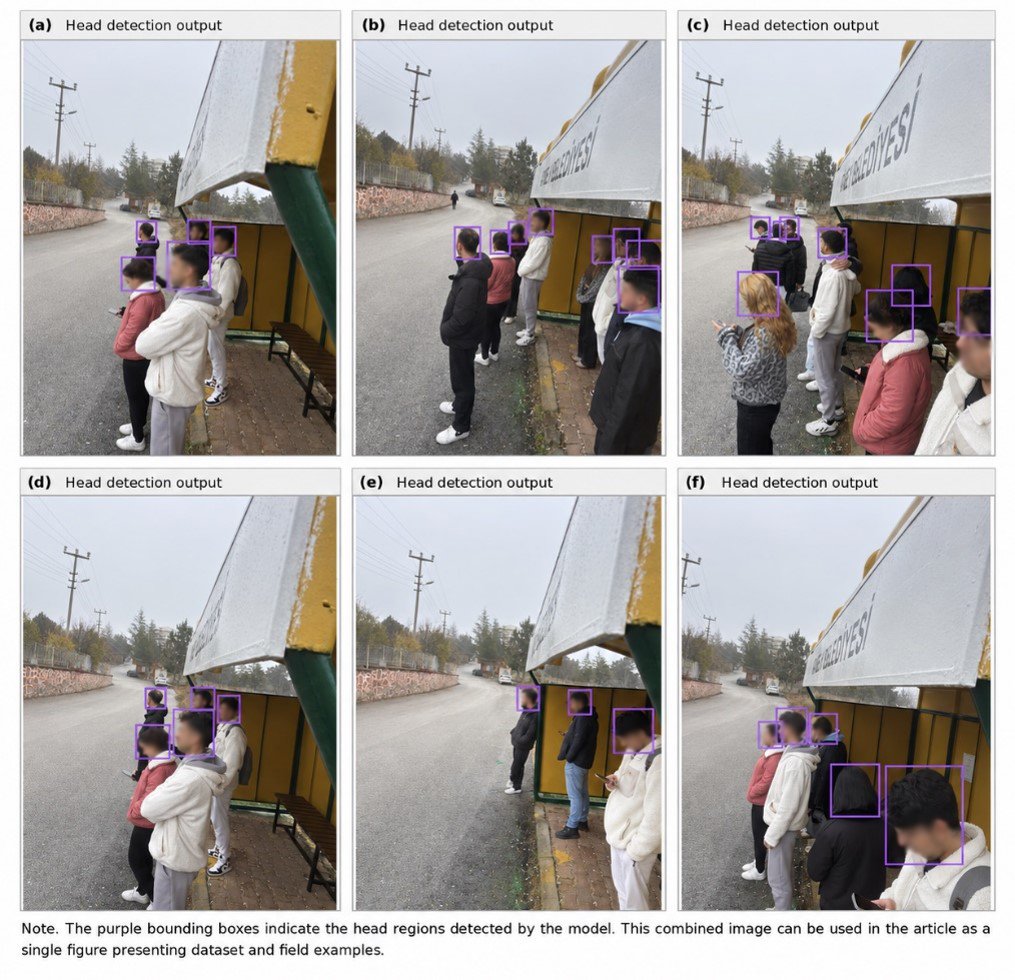
To demonstrate the model’s use case, sample field images of passengers waiting at a bus stop were used. In these images, the head regions are marked with bounding boxes, and the applicability of the model’s outputs in a real-world bus stop environment was visually assessed. The images include varying numbers of people, different standing positions, partial overlaps, side views, rear views, and different distance conditions. This helps represent the variable scene conditions the model may encounter in practical use.
The resolution of all photos used in the study is 640\(\times\)640 pixels. This consistency ensured that the model was trained on a fixed input size thus establishing computational uniformity during training. The head region was identified as the target object class in the images. Annotations of each head region were performed by using a bounding box object detection format. The objective was for the model to understand the position of head regions in the image and their number. The head detection strategy is best suited for pedestrian counting in a crowded station environment when the entire body is not visible, people partially obscure one another, and when only the upper body i.e. head region is visible. This is the reason why the model was evaluated for head detection only and not person detection.
A deep learning-based object detection model was trained to detect passenger head regions in bus stop images. The model was configured to perform single-class object detection, where the target class was defined as the passenger head. The input image size was set to 640 \(\times\) 640 pixels in accordance with the dataset structure. During training, bounding box localization loss, classification loss, and distribution-based localization loss were monitored. Model performance was evaluated using precision, recall, F1 score, mAP@50, and mAP@50–95. To ensure reproducibility, the main training configuration should be reported in detail, including the model architecture, number of epochs, batch size, optimizer, learning rate, hardware environment, and inference configuration. Reporting these parameters is essential because the proposed model is intended for real-time or near-real-time use in future public transportation systems. Training configuration of the proposed head detection model is shown in Table 1.
| Parameter | Value |
|---|---|
| Model architecture | YOLOv11 |
| Input image size | 640 \(\times\) 640 |
| Number of classes | 1 |
| Target class | Passenger head |
| Number of epochs | 200 |
| Train/validation/test split | 75% / 15% / 10% |
The model is evaluated using algorithms score such as precision, recall, F1 score, and mAP@50. Precision refers to the percentage of areas the model identified as heads that are actually correct. Recall refers to the amount of actual head regions in the image that can be detected by the model. The F1 score reflects the model’s balanced performance. It is calculated as harmonic mean of precision and recall values. On the other hand, mAP@50 is an average precision value that uses an IoU threshold of 0.50 to determine the overall performance of object detection. Being assessed collectively, the analysis checks both the ability of the model to create accurate detections and its ability to capture existing head regions without being missed as well.
After the detection stage, the number of detected head regions was interpreted as the estimated number of passengers waiting at the bus stop. To make this output usable for transportation operations, the estimated passenger count was converted into three density levels: low, medium, and high. These density levels were then linked with possible operational responses in a future public transportation system
The proposed decision logic is designed as a rule-based operational interpretation layer. In practical deployment, the threshold values can be adjusted according to bus capacity, route frequency, stop type, historical demand, and local public transport policies. Therefore, the density classes used in this study should be interpreted as a flexible decision-support structure rather than fixed universal thresholds. Passenger density classification and operational decision logic is shown in Table 2.
| Detected passenger count | Density level | Operational interpretation | Suggested transport response |
|---|---|---|---|
| 0–5 | Low density | Low stop-level passenger demand | Maintain regular service; avoid unnecessary additional dispatch |
| 6–15 | Medium density | Normal stop-level passenger demand | Continue scheduled operation |
| \(>\)15 | High density | Increased passenger accumulation at the stop | Increase service frequency or dispatch an additional vehicle |
| Repeated high density | Persistent peak demand | Demand exceeds regular timetable capacity | Revise timetable or allocate higher-capacity vehicles |
| Repeated low density | Persistently low demand | Possible inefficient service interval | Reconsider frequency or route allocation |
The proposed framework can be integrated into a smart bus stop architecture for future public transportation systems. Intelligent transportation systems are based on the integration of sensing, communication, data processing, and decision-support technologies in transport infrastructure [5]. In this architecture, a camera installed at the bus stop captures images or video frames of the waiting area. These visual data are processed either by an edge device located at the stop or by a cloud-based server connected to the public transport operation centre. The deep learning model detects passenger head regions and converts the detected head count into a stop-level passenger density estimate. Smart bus stops are important components of advanced public transport systems because they can provide real-time information, support passenger services, and contribute to operational decision-making [22]. The density estimation output obtained from the proposed model can be categorized into low, medium, or high demand levels. These density levels can be transmitted to the public transport operation centre, where they may support operational decisions such as maintaining regular service, increasing service frequency, dispatching additional vehicles, or revising timetables.
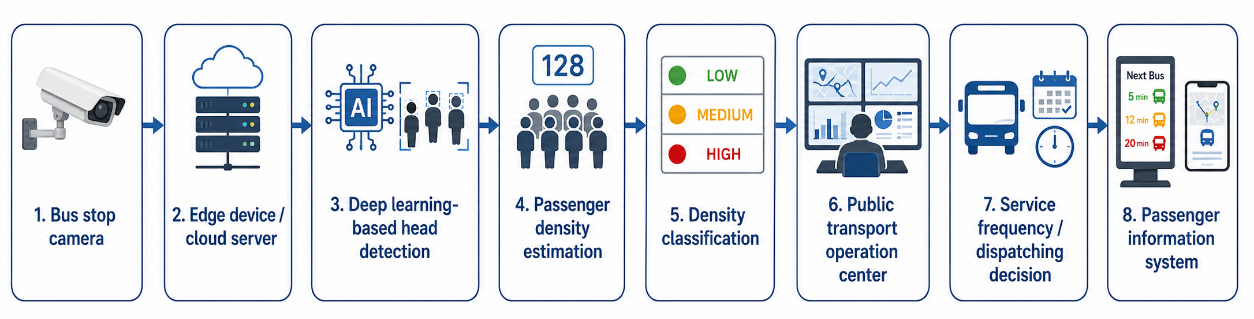
The same information can also be integrated into passenger information systems to improve service transparency and passenger-oriented mobility. Previous studies have shown that real-time transit information can positively affect passengers’ travel decisions and improve their perception of public transport services [7]. Therefore, camera-based passenger density estimation can contribute not only to operational planning but also to passenger information and service reliability. Proposed smart bus stop architecture for future public transportation system is shown in Figure 1.
This architecture demonstrates how camera-based passenger density estimation can transform smart bus stops from passive waiting areas into active sensing and decision-support nodes. Such a system can support adaptive public transport management by providing real-time, stop-level, and data-driven demand information.
In this study, a head-detection-focused object detection model was evaluated to determine passenger density at bus stops using image processing techniques. The findings are presented under the following headings: dataset distribution, model performance metrics, loss trends during training, and qualitative evaluation based on field images.
The dataset used in this study consists of a total of 1,558 images. All images are 640\(\times\)640 pixels in size. The dataset has been divided into training, validation, and test sets. The training set was used during the model’s training process, the validation set was used to monitor model performance during training, and the test set was used for the independent evaluation of the model. Dataset distribution is shown in Table 3.
| Dataset subset | Number of images | Ratio | Image size | Purpose of use |
|---|---|---|---|---|
| Training | 1169 | 75% | 640\(\times\)640 | Learning model parameters |
| Validation | 234 | 15% | 640\(\times\)640 | Monitoring model performance during training |
| Test | 155 | 10% | 640\(\times\)640 | Independent model evaluation |
| Total | 1558 | 100% | 640\(\times\)640 | Entire study dataset |
As shown in Table 3, the dataset has been largely allocated to the training set. This has enabled the model to learn the visual features of the head region from a broader sample. Keeping the validation and test sets separate is important for assessing whether the model has merely adapted to the training data.
The model’s performance on the validation set was evaluated using mAP@50, precision, recall and the F1 score. The results are presented in Table 4.
| Performance metric | Obtained value | Interpretation |
|---|---|---|
| mAP@50 | 93.6% | Indicates that the model achieves high object detection performance at an IoU threshold of 0.50. |
| Precision | 93.6% | Shows that the regions detected as heads by the model are largely correct. |
| Recall | 87.3% | Indicates that a substantial proportion of the actual head regions in the images are successfully detected by the model. |
| F1 score | 90.3% | Shows that the model achieves a balanced overall performance between precision and recall. |
According to Table 4, the model’s mAP@50 value of 93.6% indicates that the head detection task was performed with high accuracy. The precision value of 93.6% indicates that the model’s false positive rate is relatively low. This result demonstrates that the regions identified as heads by the model are largely classified correctly.
The recall value of 87.3% indicates that the model captures a significant portion of the actual head regions, but some head regions may be missed. This is believed to be due to factors such as overlaps in crowded scenes, people being viewed from the side or from behind, the head region being small in scale, and partial visibility at the edges of the image. The F1 score of 90.3% indicates that the model offers a generally balanced and reliable detection performance. Figure 2 shows the number of people detected at a sample bus stop.
To enable a more detailed interpretation of the model’s performance, each metric has been assessed separately in terms of its functional significance. The significance of performance metrics in the operational context is shown in Table 5.
When these metrics are evaluated together, it is evident that the model is sufficiently successful to be used for determining passenger density in real-world environments, such as bus stops, through head detection. In particular, the high precision value enhances the reliability of the system’s detections. Conversely, the fact that the recall value is lower than the precision value indicates that the model may miss some actual head regions, suggesting that data diversity needs to be increased in future studies. The training, validation and detection performance curves for the head detection model are shown in Figure 3.
| Metric | Technical meaning | Interpretation in this study |
|---|---|---|
| Precision | Indicates how many of the detected objects are correct. | Shows that the regions marked as heads by the model have high detection accuracy. |
| Recall | Indicates how many of the actual objects are detected. | Shows that most of the passengers at the bus stop can be detected, although some difficult cases may be missed. |
| F1 score | Represents the harmonic mean of precision and recall values. | Indicates that the model generally achieves a successful balance between false positives and false negatives. |
| mAP@50 | Represents the mean average precision at an IoU threshold of 0.50. | Shows that a high level of detection performance is achieved in localizing head regions. |
Figure 3 shows the epoch-by-epoch changes in training and validation losses, as well as detection performance metrics, for the head detection model. The graphs generally indicate that the model underwent a stable learning process and that detection performance increased significantly as training progressed.
Upon examining the training losses, it is observed that the train/box_loss, train/cls_loss, and train/dfl_loss values decrease steadily as the number of epochs increases. The decline in the train/box_loss curve indicates that the model is learning to predict the positions of bounding boxes for head regions with increasing accuracy. The significant decrease in the train/cls_loss value indicates that the model’s ability to distinguish the target class improved throughout the training process. Similarly, the decline in the train/dfl_loss curve suggests that the accuracy of bounding box localization improved over time.
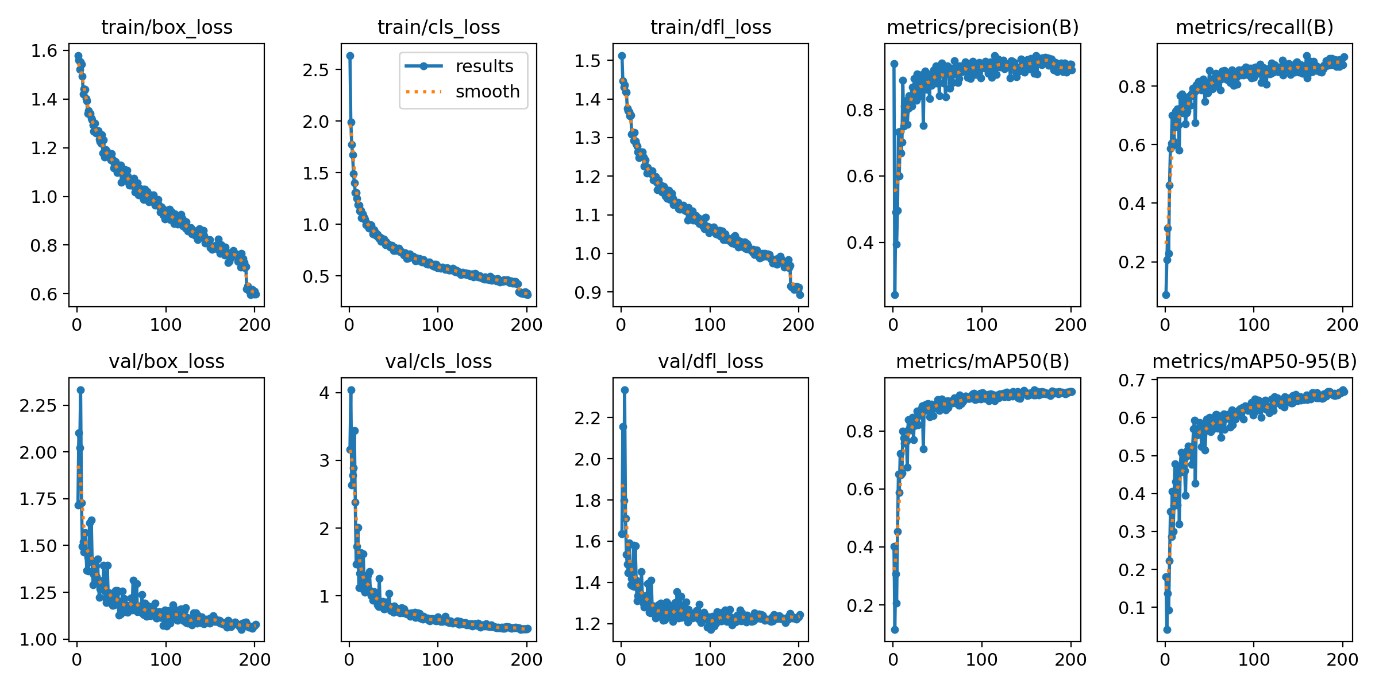
When evaluated in terms of validation losses, a rapid decline is observed in the val/box_loss, val/cls_loss, and val/dfl_loss curves, particularly in the first epochs, while losses stabilize at a more consistent level in subsequent epochs. This suggests that the model is not merely learning from the training data but is also capturing generalizable patterns in the validation data. The absence of a noticeable upward trend in validation losses at the end of training suggests that the model does not suffer from a significant overfitting problem.
An analysis of the performance metrics reveals that the precision curve rises rapidly from the early epochs and stabilizes at a level of approximately 90% or higher in subsequent epochs. This result indicates that the regions identified as heads by the model are largely accurate and that false positives remain limited. The recall curve also shows an increase throughout the training process and stabilizes in the approximately 85–90% range. This indicates that the model successfully captures a significant portion of the actual head regions present in the images. However, the fact that the recall value remains lower than the precision value suggests that some head regions may be missed due to factors such as partial overlap, small scale, different viewing angles, or being located at the edge of the image.
It is observed that the metrics/mAP50(B) curve rises rapidly as training progresses and stabilizes at approximately 93–94% in the final epochs. This value indicates that the model achieves high detection performance in the head detection task at the IoU=0.50 threshold. In contrast, the fact that the metrics/mAP50-95(B) value remains at a lower level compared to mAP@50 suggests that the precision of bounding box localization decreases relatively at tighter IoU thresholds. This is an expected result in object detection studies; because the mAP@50-95 metric requires the model not only to locate the object but also to place the bounding box boundaries more precisely.
Overall, Figure 2 shows that the head detection model reaches a stable learning process after approximately 200 epochs. The decrease in training and validation losses, along with the rise in precision, recall, and mAP values reaching a plateau, demonstrates that the model is sufficiently successful for head detection in stationary environments. In particular, the high mAP@50 and precision values indicate that the model can reliably detect head regions. The epoch-based mAP performance change of the head detection model is shown in Figure 4.
Figure 4 presents the mAP-based performance curves of the head detection model as a function of the number of epochs. The graph illustrates how the model’s detection performance evolved throughout the training process and the level of stability it achieved in the final epochs.
The graph shows that both performance curves exhibit a rapid increase in the early epochs. This indicates that the model began to quickly learn the basic visual patterns associated with head regions at the start of the training process. Notably, significant increases in performance values are observed within the first 20–30 epochs. This rapid increase is important as it indicates that the model is moving away from its initial weights and adapting to the structure of the target object in the dataset.
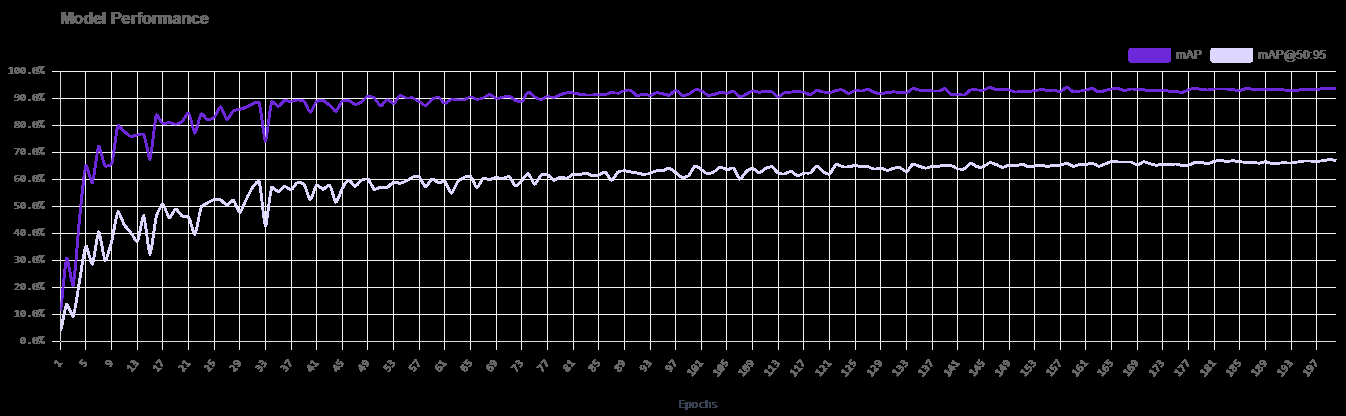
The top performance curve, shown in purple, rises above approximately 90% as the training process progresses and reaches a more stable level in subsequent epochs. The fact that the curve flattens out in the final sections indicates that the model is approaching a point of saturation in the learning process and that additional epochs contribute little to performance. This result demonstrates that the model has achieved high detection performance in the head detection task.
The second, lighter-coloured curve, while remaining at a lower level, shows a steady upward trend throughout the training process. Since this metric represents stricter localization criteria, it is expected to remain at lower values compared to the upper curve. In object detection studies, as the IoU threshold becomes stricter, it is no longer sufficient for the model to simply detect the object; the bounding box must align more precisely with the actual object boundaries. Therefore, the fact that this curve remains at a lower level indicates that, despite the model’s high overall detection accuracy, the precision of the bounding box can still be improved.
Some fluctuations are observed in the graph during the early epochs. These fluctuations can be considered normal as the model optimizes its parameters at the beginning of training. The decrease in fluctuations and the stabilization of the curves in later epochs indicate that the optimization process has become more stable. In particular, the performance curves reaching a more horizontal form after epochs 80–100 suggest that the model has reached a certain level of convergence in its learning process. Overall, Figure 3 demonstrates that the head detection model exhibits a successful performance increase throughout the training process. The mAP values reaching high levels demonstrate that the model can reliably detect head regions in bus stop images.
During the training process, loss metrics for box loss, class loss and object/localisation-based loss were monitored. According to the training graphs provided in the results file, the loss metrics generally decreased as the training progressed. This indicates that the model gradually learned the location and class features of the head regions during the training process. Assessment of trends in dropout rates during the education process is shown in Table 6.
| Loss/metric type | Observed trend | Interpretation of findings |
|---|---|---|
| Box loss | Shows a decreasing trend as training progresses. | Indicates that the model gradually learns to localize head regions more accurately. |
| Class loss | Decreases markedly during the training process. | Shows that the model’s ability to distinguish the target class improves over time. |
| Object/DFL loss | High in the initial epochs and becomes more stable in later epochs. | Indicates that object presence and localization information become more consistent throughout training. |
| Precision curve | Tends to increase and stabilize as training progresses. | Shows that the model’s false positive rate decreases. |
| Recall curve | Increases throughout the training process. | Indicates that the model’s ability to detect actual head regions improves. |
| mAP@50 curve | Reaches a high level and stabilizes. | Shows that the model’s overall detection performance becomes stable by the end of training. |
The findings summarised in Table 4 indicate that the model exhibited stable learning behaviour during the training process. The reduction in missing values and the improvement in performance metrics support the conclusion that the model has learned meaningful patterns in the head detection task. Furthermore, the high validation performance values indicate that the model has not merely adapted to the training set at a rote memorisation level but has also produced successful results on the validation data.
An examination of the sample bus stop images used in the study reveals that the model is capable of detecting head regions at different angles, distances and varying levels of density. In particular, standing passengers, individuals partially overlapping within the bus stop, people viewed from the side, and head regions partially located at the edge of the image are significant for the evaluation of the model. Qualitative assessment based on sample field images are shown in Table 7.
| Observed condition | Effect on model output | Evaluation |
|---|---|---|
| Different person densities | Requires the detection of multiple head regions in the same image. | The model appears to be applicable in scenes containing multiple individuals. |
| Partial occlusion | Causes some head regions to be only partially visible. | This may be one of the possible reasons why the recall value is lower than the precision value. |
| Side or rear view | Causes the head region to differ from the conventional frontal face appearance. | The model appears to operate effectively across different head orientations. |
| Different distance conditions | Distant head regions occupy a smaller visual area in the image. | Detection performance may decrease for small-scale head regions. |
| Real bus stop environment | Background elements such as the bus stop structure, road, and surrounding objects are included in the image. | This is important for evaluating the applicability of the model under real field conditions. |
The results of the qualitative evaluation show that the model is applicable not only to controlled images but also to scenes resembling real-world bus stop environments. However, crowds, partial occlusions and small-scale head regions are key factors that may challenge the model’s performance.
The findings indicate that a head-detection-based passenger density estimation approach can be used as a practical sensing component for future public transportation systems. The model achieved a mAP@50 of 93.6% and an F1 score of 90.3%, indicating that the proposed method can detect passenger head regions with high reliability. However, the main contribution of the proposed approach is not limited to detection accuracy. The detected head count can be transformed into an operational passenger density indicator and used to support stop-level demand monitoring. In future public transport operations, such information can help operators identify stops with high passenger accumulation, detect peak-demand periods, support additional vehicle dispatching, and improve capacity allocation. Conversely, repeated low-density observations may indicate inefficient service intervals and support frequency optimization. Therefore, the proposed system can be considered a data-driven decision-support component for smart bus stops and demand-responsive public transport planning.
The results also indicate that the proposed approach can contribute to passenger-oriented mobility services. By detecting high-density conditions at bus stops, operators may reduce excessive waiting times, prevent overcrowding, and provide more reliable public transport services. From a system perspective, integrating camera-based passenger density estimation with operation centres, route planning systems, and passenger information platforms can support the transition from static timetable-based public transport management to more adaptive and responsive future transportation systems. Contribution of model outputs to future public transportation operations is shown in Table 8.
| Model output | Transportation interpretation | Future transportation application | Expected contribution |
|---|---|---|---|
| Detected head count | Number of waiting passengers | Stop-level demand monitoring | Real-time passenger density estimation |
| Density level | Low, medium, or high demand | Smart bus stop management | Operational demand classification |
| Repeated high density | Persistent passenger accumulation | Demand-responsive dispatching | Additional vehicle dispatching or service frequency increase |
| Repeated low density | Low stop-level passenger demand | Service optimization | Reduction of inefficient service intervals |
| Time-based density variation | Peak and off-peak demand pattern | Timetable revision | Data-driven public transport planning |
| Visual verification | Objective field observation | Transport operation centre | Evidence-based decision support |
The main findings of the study are summarised in Table 9. Overall, the findings indicate that the head-detection-based object detection approach is an effective method for determining passenger density in bus stop environments. The model’s high precision and mAP@50 values demonstrate that the detected head regions are reliable. However, the relatively lower recall value suggests that field conditions such as partial occlusion, small-scale head regions and varying viewpoints may influence the model’s performance.
| Findings | Result |
|---|---|
| Data set size | A total of 1,558 images measuring 640\(\times\)640 pixels were used. |
| Data segmentation | The data has been split into 75% training, 15% validation and 10% test sets. |
| The most important success metric | The mAP@50 value was found to be 93.6%. |
| Detection reliability | The precision value is 93.6%, indicating that there are few false positives. |
| Capture success rate | The recall value is 87.3%, indicating that some head regions may be missed. |
| Overall balance performance | The F1 score was found to be 90.3%. |
| Educational behaviour | The number of missing values has decreased, whilst performance metrics have improved. |
| Application potential | The system can be used to monitor stop occupancy and to support route planning. |
Real-time applicability is an essential requirement of the proposed framework as it is aimed at future pubic transport systems. For practical smart bus stop implementation, the model needs to be able to process camera images with a sufficiently low latency to allow timely operational decisions. Accordingly, in addition to detection accuracy, inference time, frames per second, model size and processing environment should be reported. The importance of real-time applicability in that the information on passenger density must be transmitted to the decision-maker in a useful time interval; otherwise, it will lose operational value. When heavy passenger accumulation occurs at a stop, the operation centre should be able to respond rapidly, e.g. by sending extra vehicle(s), increasing the frequency of service or passing information to the passengers. Thus, the future implementation of the proposed framework should assess not only the object detection accuracy but also the computational efficiency and response time. Table 10 shows the indicators for real-time applicability.
| Indicator | Value | Interpretation |
|---|---|---|
| Inference time per image | 18 ms | Indicates low processing latency suitable for near real-time passenger density estimation |
| FPS | 55 FPS | Indicates suitability for real-time video stream processing at smart bus stops |
| Model size | 45 MB | Indicates feasible deployment on GPU-supported edge devices or compact local servers |
| Processing device | NVIDIA GPU-enabled workstation | Shows that the model was evaluated under GPU-supported processing conditions |
| Input resolution | 640 \(\times\) 640 | Image size used during inference |
| Deployment mode | Edge / cloud / hybrid | Indicates possible system integration strategy for smart bus stop and operation centre communication |
To demonstrate the potential operational use of the proposed model, a scenario-based assessment was designed. In this scenario, the estimated number of passengers waiting at a bus stop is converted into a density level and then linked with a possible public transport operational response. This assessment does not replace a full-scale transport simulation. Rather, it demonstrates how the output of the head detection model can be transformed into a decision-support variable for future public transportation systems. Example operational scenario based on detected passenger density is shown in Table 11.
This scenario-based assessment shows that the proposed model output can be interpreted beyond technical detection performance. The detected passenger count can function as a practical operational variable that supports service planning, capacity management, and smart bus stop monitoring. In a real-world implementation, this decision logic can be integrated with timetable data, automatic vehicle location systems, passenger information systems, and public transport operation centres.
Attention should be drawn to privacy and data governance issues since the proposed framework is built on image-based monitoring. The system must be engineered to calculate passenger density without saving identifiable face images. Practical deployments should develop privacy-preserving implementation methods, including edge-based processing, anonymization, minimal retention of data, and privacy-by-design. The system’s purpose should be limited to an aggregate passenger density estimation and public transport decision support. The system must not be employed for identifying, tracking or profiling individuals. Such consideration will ensure public trust and responsible use of AI in future transport systems.
| Scenario | Detected passenger count | Density level | Operational decision | Expected transportation benefit |
|---|---|---|---|---|
| S1 | 3 | Low | Maintain regular service | Avoid unnecessary additional dispatch |
| S2 | 9 | Medium | Continue scheduled operation | Maintain balanced service |
| S3 | 18 | High | Dispatch additional vehicle or increase frequency | Reduce passenger waiting and crowding |
| S4 | High density repeated across several intervals | Persistent high demand | Revise timetable | Improve capacity planning |
| S5 | Low density repeated across several intervals | Persistent low demand | Reconsider service frequency | Improve operational efficiency |
The study has several limitations. Even though the model has high detection performance, the size of the dataset is relatively small and it can be expanded with more images captured from different types of bus stops, lighting conditions, weather conditions, crowd densities and camera angles. Furthermore, while the present study mainly assesses detection performance and offers a decision-support framework, a large-scale transport simulation is required to quantify the impacts on waiting time, vehicle occupancy, service reliability and operational efficiency using real passenger flow and timetable data. Next, going forward, future additions should also report deployment metrics in real-time such as inference time, FPS, latency etc. and edge-device performance. The passenger density estimation system proposed should be linked to the real-time operation data of public transport, A. V. L. systems, and route planning system. Additionally, conducting comparative experiments with different object detection models will allow us to find the most suitable architecture for the smart bus stop. In order to support responsible adoption in future systems, privacy-preserving and governance-compliant implementation strategies should be investigated.
This research focuses on passenger density estimation at bus stops under intelligent transportation systems using image processing and deep learning-based head detection technique. The study is primarily aimed at enabling quantitative measurement of passenger density by automatically detecting head regions of people in the stop environment and demonstrating its usability in public transport planning. The total number of images that were used in the study was 1558 and each image was of 640\(\times\)640 pixels. Allocating the data to the training, validation, and test sets can help in assessing the learning behaviour of the model and its generalization ability. The results on the validation set of mAP@50 at 93.6%, precision at 93.6%, recall at 87.3% and F1 score at 90.3% indicate that the proposed head detection method achieves high detection accuracy on bus stop images. The high precision score indicates that the regions detected as heads by the model are likely correct and there are not many false positives. The fact that recall is lower than precision suggests that some head regions get missed due to field condition factors such as partial occlusion, small scale size, seeing in side or rear views and partial visibility at the image edge. The detection performance of the model has been found to offer a generally balanced and reliable performance as the F1 score is greater than 90%.
The performance and loss curves for the training process revealed that the box loss, class loss, and localization loss decreases as the number of epochs increases, while the precision, recall, and mAP values increases and level off. This result shows that the model was able to learn the spatial and class-specific features of head regions and had obtained a stable performance level by the end of training. A high mAP@50 value indicates that the model is usually correct regarding which region contains the head. The lower mAP@50-95 score shows that it can improve in locating the correct bounding boxes. The research confirms a head-detection based object recognition approach is an effective means for passenger density estimation at public transport stoppages. The utilization of the system can not only help in counting the passenger load but can also help in taking a decision about the increase in route frequency, the identification of peak hours, sending additional vehicles, the decrease in unnecessary trips, improvement of energy efficiency and increase passenger satisfaction. To sum up, the present study shows that the head detection mechanism based on image processing could be a key decision-support mechanism for sustainable and data-driven management of public transport. The proposed approach, when used with real-time camera systems could contribute towards stop based passenger density monitoring and dynamic routing processes. It is suggested that future works should use a better dataset that includes different weather and day-night conditions, different stop types, different density crowd images and camera angles. Evaluating the performance of the model in real-time against various object detection architectures and integrating it with route optimization systems can make the approach more useful.
The author received no financial support for the research, authorship, or publication of this article.
Ethical approval was granted by the Social and Human Sciences Ethics Committee of Süleyman Demirel University on June 29, 2026 (Meeting No. 199; Decision No. 37).
The author declares no conflict of interest.
The data supporting the findings of this study are available from the author upon reasonable request.