

Cross-border mobility has become an increasingly important element of regional development in Europe, particularly in regions where metropolitan areas extend beyond national borders. The gradual integration of European economies, the removal of institutional barriers, and improvements in transport infrastructure have significantly increased the intensity of interactions between neighboring countries. These processes have contributed to the emergence of cross-border regions characterized by strong labor mobility, commuting, and demographic inflation.
In such regions, national borders no longer function solely as barriers separating economic and social systems. Instead, they increasingly represent zones of interaction in which conditions on both sides of the border shape population mobility, labor markets, and housing opportunities. Cross-border commuting and migration thus become important mechanisms through which households adapt their housing and employment strategies. This dynamic is particularly visible in metropolitan border regions, where commuting distances are relatively short and economic differences between neighboring countries create incentives for mobility [1].
One key consequence of intensified cross-border mobility is the emergence of new residential dynamics in municipalities near national borders. While labor markets and employment opportunities remain concentrated in metropolitan centers, housing demand may shift to surrounding areas with more favourable housing conditions. This process often leads to the expansion of suburban residential zones beyond the administrative boundaries of metropolitan regions and, in some cases, even beyond national borders. As a result, municipalities located in border regions may experience demographic growth.
This development is often interpreted as a form of cross-border suburbanization, in which residential functions expand into neighboring countries while maintaining strong functional links with metropolitan labor markets [2, 3]. In such contexts, municipalities located near national borders may gradually transform into residential satellites of nearby metropolitan centers. The resulting spatial structure is typically characterized by strong commuting linkages, rising housing demand, and changing demographic dynamics.
Despite the growing importance of these processes, measuring housing pressure at the local level remains methodologically challenging. Housing dynamics are multidimensional and influenced by several interconnected factors, including population growth, household formation, migration flows, and commuting patterns. Individual indicators capture only specific aspects of these processes and may therefore provide an incomplete picture of the underlying dynamics.
The study makes three main contributions to the literature on residential pressure and cross-border regional development. First, it provides a methodological contribution by developing a composite Residential Pressure Index (RPI), which integrates several demographic and functional indicators into a single synthetic measure capturing the intensity of residential pressure at the municipal level. Second, the study makes an empirical contribution by applying this index to Austrian municipalities and examining the spatial distribution of residential pressure across different settlement types. Third, the research contributes to spatial analysis by employing multidimensional and spatial statistical methods, including principal component analysis and spatial autocorrelation techniques, to identify clusters of municipalities with similar levels of residential pressure. Through this approach, the study provides new insights into the spatial patterns of residential pressure and their relationship to broader regional processes, including suburbanization, commuting mobility, and cross-border residential mobility shaped by functional linkages between metropolitan regions, their labor markets, and the wider regional hinterland.
Cross-border mobility has become an increasingly important dimension of regional development in Europe, particularly in regions where metropolitan areas extend beyond national borders. The gradual process of European integration, the removal of institutional barriers, and improvements in transport infrastructure have significantly intensified economic and social interactions between neighboring countries. As a result, many border regions have evolved into functionally integrated territories characterized by intensive commuting, labor mobility, and demographic interconnections [4–8]. These transformations reflect broader processes of spatial integration within the European Union, where cross-border regions increasingly function as interconnected areas.
The theoretical foundations for understanding population mobility are rooted in migration theory. One of the most influential frameworks is Lee’s push–pull theory of migration (1966), which explains migration as the result of factors that push individuals away from their place of origin and factors that attract them to alternative destinations. In rapidly growing metropolitan areas, rising housing prices, congestion, and limited housing availability may push households to seek housing opportunities outside urban cores. Conversely, lower housing costs, better environmental conditions, and greater housing availability in surrounding areas may function as pull factors attracting new residents. This theoretical framework has been widely applied in studies of residential mobility and population spatial redistribution.
Migration decisions are rarely made exclusively by individuals. The New Economics of Labor Migration emphasizes that households often serve as the primary decision-making units and adopt strategies that optimize both income opportunities and living conditions [9, 10]. From this perspective, migration is often seen as a household strategy to reduce economic risk and improve long-term prosperity. In a cross-border context, such strategies may involve maintaining employment in metropolitan labor markets while relocating to areas with more affordable housing. This spatial separation between workplaces and residential areas often generates strong commuting patterns linking residential areas with employment centers in neighboring regions or even across national borders.
New economic geography provides an additional explanation for these spatial dynamics. According to Krugman [11], economic activities tend to concentrate in metropolitan centers due to agglomeration economies and productivity advantages. At the same time, rising land prices and housing costs in urban centers encourage residential development into peripheral areas where housing is more affordable. This spatial separation between places of work and places of residence increases commuting and strengthens functional linkages between metropolitan centers and their surrounding regions [12, 13]. As a result, metropolitan labor markets often extend far beyond administrative boundaries, creating broader functional urban regions characterized by intensive daily mobility [14].
In cross-border metropolitan regions, processes of suburbanization may extend beyond national borders. In the literature, this phenomenon is increasingly referred to as cross-border suburbanization, a process in which residential development expands into neighboring countries while maintaining strong functional connections to metropolitan labor markets [2, 3]. In such contexts, border municipalities may gradually transform into residential satellites of metropolitan centers located in another country, particularly when commuting distances are relatively short and transport accessibility is high. Empirical studies of European border regions suggest that these processes are often accompanied by demographic growth, increased commuting intensity, and changes in the socio-demographic composition of local populations [7, 8].
The literature on cross-border regions emphasizes that national borders increasingly function as less barriers and more as zones of interaction and integration [4, 6]. In highly integrated border regions, daily mobility patterns often extend across national borders, creating functional cross-border labor markets and interconnected residential systems. Wallace [1] describes this transformation through the concept of the border mobility paradigm, in which individuals organize their economic and social activities across multiple national contexts and combine opportunities offered by different institutional environments. Such mobility patterns are particularly evident in metropolitan border regions, where economic complementarity and commuting accessibility support strong cross-border interactions [5, 15].
The expansion of residential areas in suburban and cross-border regions often creates increasing pressure on local housing systems. Growing housing demand may manifest as population growth, changes in household numbers, higher commuting intensity, and shifts in the socio-demographic composition of residents. Previous research has shown that housing demand and housing pressure in the hinterlands of metropolitan areas are closely linked to demographic growth, household formation, and commuting patterns [12, 13, 16, 17].
Since housing pressure reflects several interconnected demographic and spatial processes, analyzing it through a single indicator may not adequately capture its complexity. Composite indicators have therefore become widely used analytical tools for summarizing multidimensional socio-economic phenomena into a single synthetic measure [18, 19]. By integrating multiple indicators related to demographic change, commuting patterns, and household dynamics, composite indices can provide a more comprehensive representation of housing-related processes within a given territory. Such approaches are particularly useful for identifying spatial patterns of housing pressure across municipalities and for analyzing how housing demand relates to broader metropolitan and cross-border regional dynamics.
In this context, the Residential Pressure Index (RPI) was developed as a composite indicator designed to capture the intensity of housing pressure at the municipal level. The index integrates several demographic and functional indicators reflecting population change, household dynamics, commuting patterns, and the presence of foreign residents. By combining these variables into a single measure, the index enables the identification of municipalities facing stronger housing pressure. It facilitates the analysis of spatial patterns of housing demand within broader metropolitan and cross-border regional systems.
Based on the theoretical perspectives outlined above, residential pressure in municipalities can be interpreted as the result of several interconnected demographic and functional processes associated with metropolitan expansion and cross-border mobility. These processes are reflected in indicators that capture population growth, changes in the number and structure of households, and the intensity of commuting to metropolitan labor markets. The share of commuters primarily reflects the functional integration of municipalities within metropolitan labor markets. At the same time, changes in household numbers and sizes indicate shifts in housing demand and the structure of residential areas. The presence of foreign residents may capture the impact of migration and cross-border mobility on residential patterns, which are often linked to expanding metropolitan regions. Finally, overall population change reflects the cumulative demographic impact of these processes. Taken together, these indicators provide a multidimensional representation of residential pressure and thus serve as the empirical basis for constructing the Residential Pressure Index (RPI).
The analysis was conducted at the municipal level and is based on official statistical data for Austria for 2023. For the purposes of the analysis, municipalities were classified into three categories based on their location relative to the national border, according to the territorial division valid in 2021.
The first category comprises border municipalities that directly adjoin Austria’s national border. These are municipalities whose administrative territory touches the national border. Such municipalities represent the closest spatial context for potential cross-border interactions.
The second category consists of municipalities in the functional border zone, located within a belt of up to 20 kilometers from the national border but not directly adjacent to it. This zone represents the broader border hinterland in which functional linkages between regions may occur, for example through commuting, migration, or differences in housing markets. The functional border zone was defined by creating a 20 km buffer around the national border using GIS tools. Municipalities whose administrative boundaries intersected this buffer zone were classified as part of the functional border area.
The third category consists of non-border municipalities located outside the 20-kilometre belt from the national border. This group serves as a reference category for comparing residential dynamics between the border and the inland parts of the country.
These categories allow analysis of whether the intensity of residential pressure differs by municipality’s location relative to the national border and whether such pressures are concentrated in the immediate border area or in the broader functional border region.
The analysis of residential pressure is based on a set of indicators capturing the demographic dynamics and residential characteristics of municipalities. The variables were selected to identify processes reflecting the growth of residential demand, changes in household structure, and population mobility. All variables are available at the municipal level, allowing for detailed spatial analysis.
The share of commuters working outside their municipality of residence (AUSPEN23) reflects functional linkages between residential areas and labor-market centers. A high share of commuters typically indicates municipalities that function as residential hinterlands of larger cities and employment centers.
The annual change in the number of households (dPHH23) represents a direct indicator of increasing housing demand. Growth in the number of households may signal suburbanization or demographic changes that lead to household fragmentation.
The average household size (HHSIZ23) captures household structure. Declining household size tends to increase the number of required housing units.
The share of foreign residents (AUSLA23) serves as an indicator of demographic dynamics driven by migration, which may significantly influence local housing demand.
The annual population change (dBEV23) reflects municipalities’ demographic dynamics and is one of the fundamental factors influencing housing pressure.
In addition to these core variables, supplementary socio-demographic indicators were included in the analysis: the unemployment rate of the population aged 15 and over (ALQ_15PLUS_2023) and the number of residents younger than 15 years (BEV_UNTER15_2023). These variables represent contextual characteristics of municipalities’ socio-economic situations and age structures, which may influence the intensity of residential processes.
The empirical analysis uses official municipal-level data provided by Statistics Austria (Statistik Austria). The indicators were derived from population, household, and commuting statistics, providing comprehensive, comparable information for all Austrian municipalities. These datasets represent the most detailed publicly available source for analyzing demographic and residential dynamics at the local level.
Year-to-year changes in count indicators were expressed as relative change
to ensure comparability across municipalities of different sizes. For ratio indicators, changes were expressed as percentage-point differences.
To synthetically capture residential pressures at the municipal level, a Residential Pressure Index (RPI) was constructed. It aimed to combine several partial indicators into a single composite measure that allows the comparison of the intensity of residential processes across municipalities.
The index was constructed from five core variables: the share of commuters working outside the municipality (AUSPEN23), the year-on-year change in the number of households (dPHH23), the average household size (HHSIZ23), the share of foreign residents (AUSLA23), and the year-on-year population change (dBEV23).
Before aggregation, all variables were standardized using z-scores to eliminate the effect of different measurement scales:
where \(X_{i}\) is the value of the variable for a given municipality, \(\mu\) is the mean value, and \(\sigma\) is the standard deviation.
The variable average household size was transformed with the opposite sign, since smaller household sizes imply greater potential pressure on the housing stock.
The resulting index was calculated as the arithmetic mean of the standardized values:
Higher index values indicate greater residential pressure at the municipal level.
To test the index’s robustness, an alternative version was also calculated, expanded with additional socio-demographic indicators.
Principal Component Analysis (PCA) was used to verify the indicators’ internal structure. This method allows the identification of latent dimensions explaining the variability among mutually correlated indicators.
Five variables characterizing the demographic and residential dynamics of municipalities were included in the analysis. All variables were standardized before the analysis.
The number of retained components was determined using a combination of the Kaiser criterion (eigenvalue > 1) and visual inspection of the scree plot. The interpretation of the components was based on the correlations between the components and the original variables.
The PCA results confirmed the existence of two dominant dimensions of residential processes and served as a robustness check for the construction of the Residential Pressure Index (RPI).
The spatial distribution of the Residential Pressure Index was analyzed using spatial autocorrelation methods. First, the Global Moran’s I statistic was calculated to test for spatial autocorrelation across the entire set of municipalities. Subsequently, Local Indicators of Spatial Association (LISA) were applied to identify specific spatial clusters of municipalities with high or low index values.
All computations and spatial analyses were carried out using GeoDa and the R statistical software environment.
Border municipalities (274) were defined as municipalities whose administrative territory borders Austria’s national boundary. The functional border zone (817 municipalities) was defined as a belt of municipalities located within 20 km of the national border, while the remaining municipalities (1,026) constitute the reference group.
Spatial pressures on the housing market were operationalized using five indicators that capture key demographic and socio-economic processes influencing local housing demand. These include the share of commuters working outside their municipality of residence (AUSPEN23), the year-on-year change in the number of households (dPHH23), the average household size (HHSIZ23), the share of residents with foreign citizenship (AUSLA23), and the year-on-year change in population (dBEV23).
Table 1 presents the basic descriptive statistics of these variables at the municipal level.
| Indicator | min | max | range | mean | median | sd | skew |
|---|---|---|---|---|---|---|---|
| Share of commuters working outside their municipality (AUSPEN23) | 9.5 | 93.2 | 83.7 | 73.53 | 76.9 | 12.81 | -2.17 |
| Annual change in the number of households (dPHH23) | -5.28 | 13.82 | 19.1 | 0.91 | 0.75 | 1.49 | 1.17 |
| Average household size (HHSIZ23) | 1.7 | 3.4 | 1.7 | 2.37 | 2.4 | 0.21 | 0.32 |
| Share of foreign residents (AUSLA23) | 0.2 | 69.5 | 69.3 | 10.14 | 8.4 | 7.12 | 1.84 |
| Annual population change (dBEV23) | -7.69 | 16.13 | 23.8 | 0.23 | 0.17 | 1.43 | 1.12 |
The descriptive statistics indicate considerable variability among municipalities across the individual indicators of residential dynamics. Based on these variables, a composite Residential Pressure Index (RPI) was subsequently constructed to synthetically capture the combined influence of demographic dynamics, population mobility, and household structure on local housing demand. Prior to aggregation, the individual indicators were standardized using z-scores to ensure comparability, and variables with opposite interpretations were transformed so that higher index values consistently indicate higher residential pressure. The resulting index was then analyzed in terms of its spatial distribution at the municipal level.
To assess the robustness of the constructed Residential Pressure Index (RPI), an alternative specification of the index was calculated by extending the basic set of indicators with additional core variables capturing related socio-demographic characteristics. The index was recalculated using the same standardization procedure. A comparison of the two index versions revealed a high correlation coefficient (r = 0.8544, p-value = 0.0000) between the original and the extended index. This strong relationship confirms that the core indicators capture the main dimensions of housing pressure and that the resulting index is robust to moderate changes in the set of included variables. Therefore, the analysis presented in the following sections is based on the index constructed from the five key indicators.
The spatial distribution of the Residential Pressure Index (RPI) at the municipal level is illustrated in Figure 1. The map shows pronounced spatial differentiation in index values, with higher values concentrated in certain regional clusters of municipalities, while other areas show consistently lower levels of residential pressure. This visual pattern suggests the possible presence of spatial autocorrelation, that is, a tendency for similar index values to occur in neighboring municipalities.
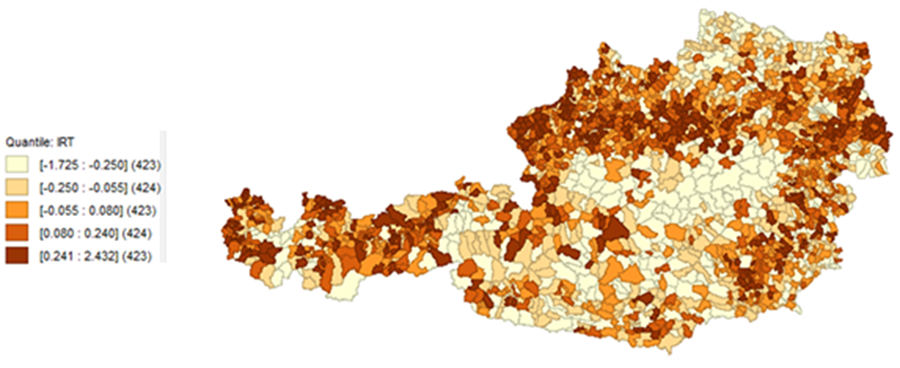
In the area along the Austrian–Slovak border, a pronounced concentration of municipalities with higher levels of residential pressure can be observed. In particular, across the wider hinterland of Vienna and in municipalities along transport corridors leading toward Bratislava, a continuous belt of municipalities with above-average index values emerges. This spatial pattern suggests that the functional linkages between Vienna and Bratislava strongly influence residential processes in this region.
The high values of the Residential Pressure Index in these municipalities likely reflect a combination of factors, particularly intensive commuting, growth in the number of households, and demographic growth. These characteristics are typical of suburbanization, in which residential demand shifts from large urban centers to their broader hinterlands. In the case of the Vienna–Bratislava region, this process may also take on a cross-border character, as differences in housing market prices and good transport accessibility support population mobility within the entire metropolitan region.
The spatial concentration of municipalities with higher residential pressure along this corridor therefore suggests that broader processes of metropolitan integration and cross-border suburbanization largely shape housing market dynamics in Austria’s border regions.
To verify the statistical significance of this clustering, an analysis of global and local spatial autocorrelation was subsequently applied. The results are presented in a Moran scatterplot and a map of Local Indicators of Spatial Association (LISA), along with a map of the statistical significance of the identified clusters.
The Global Moran’s statistic confirms the presence of significant spatial autocorrelation in the Residential Pressure Index (Figure 2). The value of Moran’s I is 0.349, indicating positive spatial autocorrelation: municipalities with similar index values tend to form spatial clusters. A permutation test with 9,999 permutations confirms the high statistical significance of the result (pseudo p-value = 0.000010), with the z-score exceeding 26. This indicates that the observed spatial pattern is not random but reflects a systematic spatial structure of residential pressures.
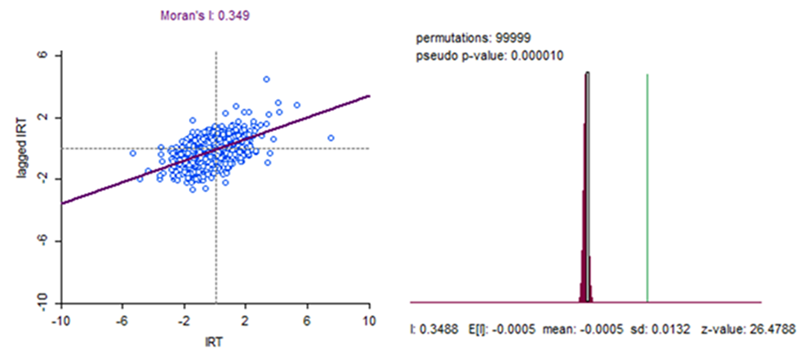
This result suggests that municipalities with high index values tend to be located near other municipalities with similarly high values. In contrast, municipalities with low residential pressure tend to cluster in other parts of the territory.
Although Moran’s I provides evidence of significant global spatial autocorrelation, it does not reveal where these spatial clusters occur. To identify specific locations of spatial concentration, Local Indicators of Spatial Association (LISA) were calculated. The resulting LISA cluster map (Figure 3) and the corresponding significance map (Figure 4) allow distinguishing municipalities that form statistically significant clusters of high and low residential pressure.
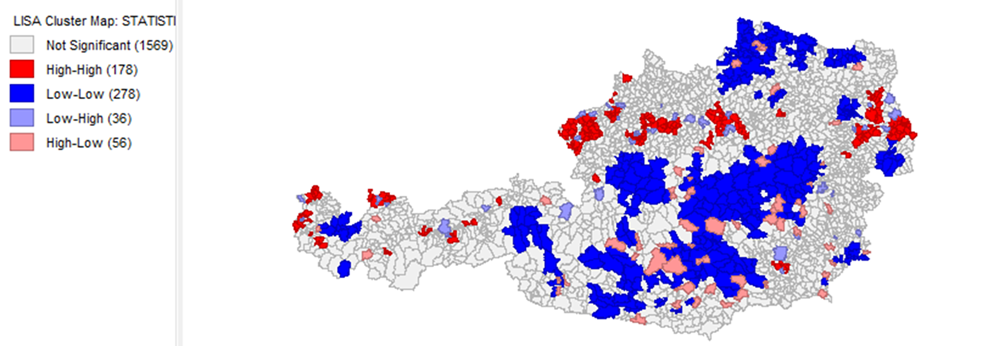
The LISA cluster map reveals several types of local spatial relationships. The most prominent are High–High clusters, which represent municipalities with high residential pressure surrounded by municipalities with similarly high index values. These clusters appear primarily along Austria’s eastern border, particularly in regions bordering Slovakia. This spatial pattern suggests the presence of strong residential processes in border areas, which may be associated with cross-border population mobility, commuting, and housing market price differentials between neighboring countries.
Conversely, Low–Low clusters identify municipalities with low residential pressure surrounded by municipalities with similarly low index values. These clusters are particularly visible in some inland regions of the country, where demographic dynamics are weaker and residential demand is less intensive.
In addition to homogeneous clusters, the spatial pattern also includes local spatial outliers of the High–Low and Low–High types. High–Low areas represent municipalities with high residential pressure in environments with lower index values, which may indicate local centers of residential dynamics. In contrast, Low–High areas represent municipalities with relatively low pressure within a broader environment characterized by higher residential pressure.
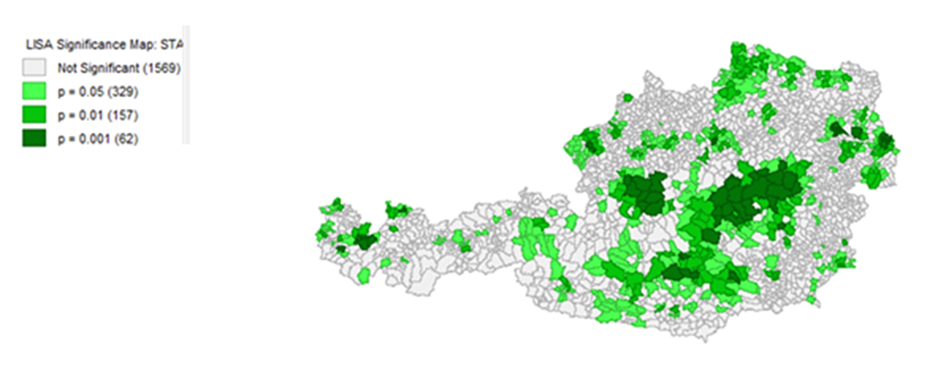
The significance of the identified clusters is further confirmed by the LISA significance map, which shows that a substantial proportion of the detected spatial patterns are statistically significant at the 0.05, 0.01, and 0.001 significance levels. The strongest spatial clusters appear in areas with intense demographic dynamics, suggesting that residential pressure is largely shaped by regional suburbanization processes and functional linkages between municipalities.
Principal Component Analysis (PCA) was applied to verify the internal structure of the selected residential pressure indicators. Five variables characterizing the demographic and residential dynamics of municipalities were included in the analysis: the share of commuters working outside the municipality (AUSPEN23), year-on-year population change (dBEV23), year-on-year change in the number of households (dPHH23), average household size (HHSIZ23), and the share of residents with foreign citizenship (AUSLA23).
The PCA results indicate that the data structure is two-dimensional. According to the Kaiser criterion (eigenvalue > 1), two significant components were identified with eigenvalues of 1.80 and 1.60. This finding is also confirmed by the scree plot, which shows a clear break after the second component. Together, the first two components account for approximately 67.9% of the total variability of the analyzed variables. This represents a relatively high proportion of explained variance and suggests that these two dimensions capture most of the information contained in the data.
The eigenvalues of the individual components and the proportion of explained variance are presented in Table 2, and Figure 5 shows the scree plot, which graphically illustrates the variance explained by each dimension.
| Eigenvalue | Variance percent | Cumulative variance percent | |
|---|---|---|---|
| Dim.1 | 1.799769 | 35.99537 | 35.99537 |
| Dim.2 | 1.595102 | 31.90205 | 67.89742 |
| Dim.3 | 0.766525 | 15.33049 | 83.22791 |
| Dim.4 | 0.477939 | 9.558772 | 92.78669 |
| Dim.5 | 0.360666 | 7.213314 | 100 |
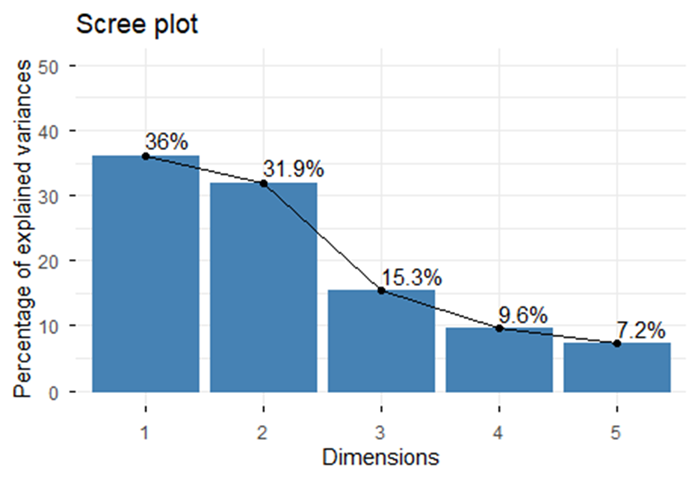
Figure 6 shows the correlation circle of the variables, illustrating the relationships between the analyzed indicators and the first two principal components.
The interpretation of the individual components is based on the correlations between the components and the original variables (Table 3). The first component (Dim1) shows a strong positive correlation with the share of commuters working outside the municipality (r = 0.81), as well as moderately strong positive correlations with year-on-year population change (r = 0.52) and year-on-year change in the number of households (r = 0.43). In contrast, average household size (r = -0.58) and the share of residents with foreign citizenship (r = -0.59) are negatively correlated with the first component. All correlation coefficients are statistically significant (p \(<\) 0.001).
This component therefore, primarily captures the dynamic aspect of residential pressure, which is associated with population and household growth, smaller household size, and a high level of commuting. Such a profile is particularly typical of municipalities with a strong suburban character, which serve as residential hinterlands for larger employment centers.
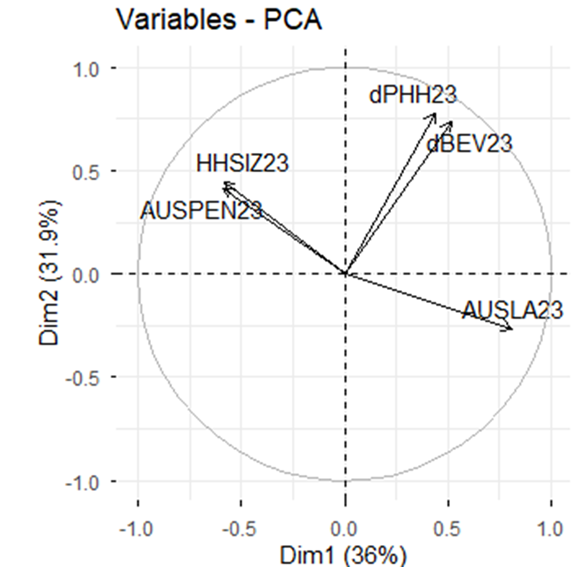
The second component (Dim2) shows the strongest positive correlations with year-on-year changes in the number of households (r = 0.78) and population (r = 0.74). Moderately strong positive correlations are also observed for average household size (r = 0.45) and the share of foreign residents (r = 0.42). The share of commuters shows a weaker negative correlation in this case (r = -0.26). All correlation coefficients are statistically significant (p \(<\) 0.001).
The second component, therefore, captures rather the demographic–structural dimension of residential processes, which is related to population and household growth, as well as household characteristics and population composition.
| Correlation with Dim 1 | P value | Correlation with Dim 2 | P value | |
|---|---|---|---|---|
| AUSLA23 | 0.812738 | 0.00E+00 | -0.2645493 | 3.10E-35 |
| dBEV23 | 0.515436 | 5.06E-144 | 0.7383776 | 0.00E+00 |
| dPHH23 | 0.43489 | 2.07E-98 | 0.7794093 | 0.00E+00 |
| HHSIZ23 | -0.58433 | 4.34E-194 | 0.4467111 | 2.31E-104 |
| AUSPEN23 | -0.58565 | 3.62E-195 | 0.4157943 | 2.79E-89 |
The results of the principal component analysis, therefore, suggest that residential pressure has two interrelated dimensions. The first dimension represents the dynamics of residential demand associated with suburbanization processes and commuting mobility, while the second dimension reflects the socio-demographic characteristics of municipalities. Despite this two-dimensional structure, the first component captures the greatest share of the indicators’ variability and represents the main latent factor of residential pressure. The PCA results also confirm that the selected variables form a coherent set of indicators suitable for constructing a composite Residential Pressure Index.
The position of municipalities in the space defined by the first two principal components, therefore, provides a useful basis for identifying different types of residential dynamics in the studied area.
Based on the results of the principal component analysis, a typology of municipalities was developed to identify different patterns of residential dynamics in space. Since the principal component scores are standardized around zero, zero serves as a natural threshold between above-average and below-average values for each dimension. By combining the signs of the first and second components, municipalities were divided into four basic types.
Municipalities with positive values for both components (Dim1 \(\geq\) 0 and Dim2 \(\geq\) 0) represent dynamic suburban municipalities, characterized by high residential dynamics, population and household growth, and strong functional linkages with employment centers.
Municipalities with a positive value for the first component and a negative value for the second component (Dim1 \(\geq\) 0 and Dim2 \(<\) 0) can be characterized as residential-commuting municipalities, where commuting for work and the suburban character of housing play a dominant role.
Municipalities with a negative value for the first component and a positive value for the second component (Dim1 \(<\) 0 and Dim2 \(\geq\) 0) represent municipalities of demographic transition, where changes in household and population structures are present but without strong suburbanization pressure.
The final group consists of municipalities with negative values for both components (Dim1 \(<\) 0 and Dim2 \(<\) 0), which can be described as stagnating municipalities, characterized by lower dynamics in residential processes and weaker functional linkages to regional employment centers.
This typology enables the identification of different forms of residential dynamics across municipalities and provides an analytical framework for examining their spatial distribution within the study area.
The characteristics of the individual municipal types can be further interpreted based on the average values of the analyzed indicators (Table 4).
| AUSPEN23 | dPHH23 | HHSIZ23 | AUSLA23 | dBEV23 | |
|---|---|---|---|---|---|
| type 1 | 75.18 | 2.54 | 2.34 | 12.80 | 1.78 |
| type 2 | 61.50 | 0.57 | 2.17 | 17.30 | 0.08 |
| type 3 | 78.76 | 1.19 | 2.54 | 5.50 | 0.42 |
| type 4 | 76.52 | -0.28 | 2.38 | 7.02 | -0.97 |
Type 1 is characterized by a high share of commuters working outside the municipality (75.2%) and the highest year-on-year increases in the number of households (2.54%) and population (1.78%). This type, therefore, represents municipalities with strong residential dynamics that serve as residential hinterlands for employment centers and exhibit characteristics of suburbanization.
Type 2 is characterized by a lower share of commuters (61.5%) but, at the same time, the highest share of residents with foreign citizenship (17.3%). The dynamics of population and household growth are more moderate in this case. This type can therefore be interpreted as municipalities with a stronger cross-border migration component in residential processes.
Type 3 is characterized by the highest share of commuters (78.8%) and, at the same time, a relatively larger average household size (2.54 persons). Demographic dynamics are moderate, while the share of foreign residents is the lowest in this type (5.5%). This type, therefore, represents municipalities with a strong commuting function that are highly integrated into regional labor markets.
Type 4 shows the lowest dynamics of both population and household growth, with the year-on-year population change even slightly negative (-0.97%). This type can therefore be characterized as stagnating municipalities with lower residential intensity.
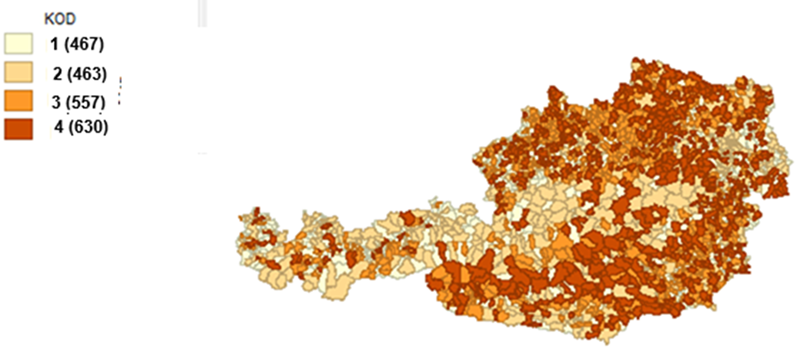
This typology enables identification of different forms of residential dynamics across municipalities and provides a suitable framework for analyzing their spatial distribution. The spatial distribution of these municipal types is illustrated in Figure 7, which shows how different patterns of housing dynamics are geographically structured within the studied area.
The relationship between municipal typology and location relative to the national border is shown in Table 5. The table presents the distribution of municipalities by type: border municipalities, municipalities within the functional border zone up to 20 km, and other municipalities.
The largest group consists of Type 4 municipalities (630 municipalities), which occur most frequently outside border areas. In contrast, Type 1 and Type 2 municipalities are relatively more common in border and functional border regions.
This pattern suggests that the different types of residential dynamics are not randomly distributed in space but are, to some extent, related to municipalities’ locations relative to the national border.
| Location relative to the national border | 1 | 2 | 3 | Total |
|---|---|---|---|---|
| Type 1 | 73 | 216 | 178 | 467 |
| Type 2 | 87 | 150 | 226 | 463 |
| Type 3 | 40 | 228 | 289 | 557 |
| Type 4 | 74 | 223 | 333 | 630 |
| Total | 274 | 817 | 1026 | 2117 |
The relationship between the typology of municipalities and their location relative to the national border was tested using Pearson’s chi-square test of independence. The results indicate a statistically significant association between the type of municipality and its location relative to the border (\(\chi^2\) = 58.17; df = 6; p \(<\) 0.001). This suggests that the distribution of municipal types across border municipalities, municipalities in the functional border zone, and other municipalities is not random. In other words, the types of residential dynamics identified through PCA exhibit systematic spatial patterns related to municipalities' proximity to the national border.
This result suggests that residential processes in municipalities are, to some extent, influenced by their location within the border region, supporting the assumption that cross-border functional linkages play an important role in shaping local housing markets.
For a more detailed interpretation of the relationship between municipal typology and border proximity, expected frequencies and Pearson residuals were also analyzed (Figure 8). Expected values represent the distribution of municipal types that would occur under the assumption of complete independence between municipal typology and border location. However, comparison with the observed values reveals systematic deviations from this expected distribution.
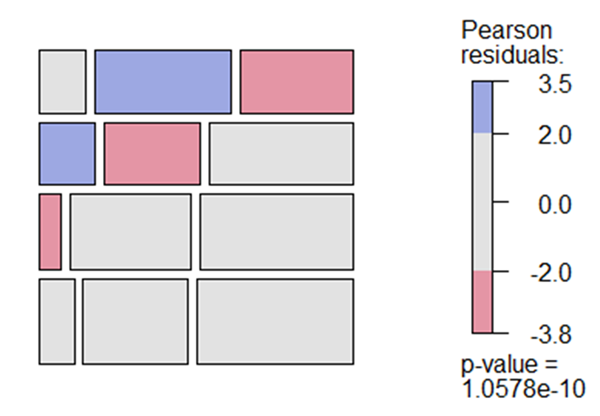
The most pronounced positive deviation is observed in Type 2 municipalities in the immediate border area, where the observed number (87) exceeds the expected value (approximately 60). In contrast, Type 3 municipalities occur less frequently in border areas than would be expected under a random distribution (40 municipalities compared with an expected value of approximately 72). In the remaining categories, the differences between observed and expected values are smaller, as reflected in the lower Pearson residuals.
A notable deviation from expected values is also observed for Type 1 municipalities outside the border area (category 3). In this group, the observed number of municipalities (178) is substantially lower than the expected value under independence (approximately 226). This suggests that Type 1 municipalities occur less frequently in inland areas than would be expected under a random distribution and are instead more concentrated in border or functional border regions. This pattern indicates that the dynamic residential processes characteristic of this type of municipality are more frequently associated with spatial proximity to the national border and functional linkages between regions.
The Pearson residual plot also visually identifies the table cells that contribute most to the chi-square statistic. Blue cells represent cases with a higher number of municipalities than would be expected under a random distribution. In comparison, red cells indicate categories with a lower than expected number of municipalities. Overall, the results confirm that the spatial distribution of municipal types is not random and that certain types of residential dynamics occur more frequently in border regions than others.
These differences confirm that the distribution of municipal types is not random in space but is to some extent related to municipalities’ location relative to the national border. Some types of residential dynamics occur more frequently in border and functional border regions, while others are more typical of inland regions. This finding highlights the importance of spatial and functional linkages in shaping local residential processes and suggests that border regions may exhibit specific patterns of housing market dynamics.
This study examined spatial pressures on the housing market in Austrian municipalities using a composite Residential Pressure Index (RPI) constructed from demographic and mobility indicators. The spatial distribution of the index revealed substantial regional variability, indicating that housing pressures are not evenly distributed across the country. Global Moran’s I confirmed the presence of statistically significant spatial autocorrelation, while LISA analysis identified specific clusters of municipalities with high and low levels of housing pressure.
To further explore the internal structure of the underlying indicators, principal component analysis (PCA) was applied, revealing two dominant dimensions capturing housing dynamics and the demographic–structural characteristics of municipalities. Based on municipalities’ positions within the space defined by these components, a typology was constructed to distinguish different patterns of housing development.
The analysis showed that these types are not randomly distributed in space and exhibit a statistically significant relationship with municipalities’ proximity to the national border. Overall, the findings suggest that housing dynamics in Austrian municipalities are shaped not only by local demographic processes but also by broader spatial and functional relationships, particularly in border regions influenced by cross-border metropolitan interactions, such as those observed in the Vienna–Bratislava area.
In the literature, this phenomenon is increasingly referred to as cross-border suburbanization, a process in which residential development expands into neighboring countries while maintaining strong functional linkages with metropolitan labor markets [2, 3]. In such contexts, border municipalities may gradually transform into residential satellites of metropolitan centers located in another country, particularly when commuting distances are relatively short and transport accessibility is high. Empirical studies of European border regions suggest that these processes are often accompanied by demographic growth, increased commuting intensity, and changes in the socio-demographic structure of the local population [7, 8].
The literature on cross-border regions emphasizes that national borders increasingly function as fewer barriers and more as zones of interaction and integration [4, 6]. In highly integrated border regions, daily mobility patterns often extend across national borders, creating functional cross-border labor markets and interconnected residential systems. Wallace [1] describes this transformation through the concept of the border mobility paradigm, in which individuals organize their economic and social activities across multiple national contexts and combine opportunities offered by different institutional environments. Such mobility patterns are particularly evident in metropolitan border regions, where economic complementarity and commuting accessibility support strong cross-border interactions [5, 15].
The expansion of residential areas in suburban and cross-border regions often creates increasing pressure on local housing systems. Growing housing demand may manifest as population growth, changes in household numbers, increased commuting intensity, and shifts in the socio-demographic composition of residents. Previous research has shown that housing demand and housing pressure in the hinterlands of metropolitan areas are closely related to demographic growth, household formation, and commuting patterns [12, 13, 16, 17].
Since housing pressure reflects several interconnected demographic and spatial processes, analyzing it through a single indicator may not sufficiently capture its complexity. Composite indicators have therefore become widely used analytical tools for summarizing multidimensional socio-economic phenomena into a single synthetic measure [18, 19]. By integrating multiple indicators related to demographic change, commuting patterns, and household dynamics, composite indices can provide a more comprehensive representation of housing-related processes within a given territory. Such approaches are particularly useful for identifying spatial patterns of housing pressure across municipalities and for analyzing how housing demand relates to broader metropolitan and cross-border regional dynamics.
In this context, the Residential Pressure Index (RPI) was developed as a composite indicator designed to capture the intensity of housing pressure at the municipal level. The index integrates several demographic and functional indicators reflecting population change, household dynamics, commuting patterns, and the presence of foreign residents. By combining these variables into a single measure, the index enables the identification of municipalities facing stronger housing pressure. It allows for the analysis of spatial patterns of housing demand within broader metropolitan and cross-border regional systems.
In cross-border metropolitan regions, processes of suburbanization may extend beyond national borders. Based on the theoretical perspectives outlined above, residential pressure in municipalities can be interpreted as the result of several interconnected demographic and functional processes associated with metropolitan expansion and cross-border mobility. These processes are reflected in indicators that capture population growth, changes in the number and structure of households, and the intensity of commuting to metropolitan labor markets. The share of commuters primarily reflects the functional integration of municipalities within metropolitan labor markets. At the same time, changes in household numbers and sizes indicate shifts in housing demand and the structure of residential areas. The presence of foreign residents may capture the impact of migration and cross-border mobility on residential patterns, which are often associated with expanding metropolitan regions. Finally, overall population change reflects the cumulative demographic impact of these processes. Taken together, these indicators provide a multidimensional representation of residential pressure and thus serve as the empirical basis for constructing the Residential Pressure Index (RPI).
This study examined residential pressure in Austrian municipalities by constructing and spatially analyzing a composite Residential Pressure Index (IRT) based on demographic and mobility indicators. The results demonstrate that residential pressure is not evenly distributed across space but exhibits clear regional patterns associated with metropolitan dynamics and cross-border interactions. The spatial distribution of the index revealed substantial regional variability, indicating that local demographic developments and broader spatial and economic processes strongly influence housing demand.
The analysis of spatial autocorrelation confirmed that residential pressure displays significant spatial clustering. The global Moran’s I statistic indicated a statistically significant positive spatial autocorrelation, suggesting that municipalities with similar levels of residential pressure tend to be geographically concentrated. The LISA cluster analysis further revealed specific areas where municipalities with high residential pressure form spatial clusters, particularly along Austria’s eastern border.
The results, therefore, suggest that residential dynamics in border municipalities are closely linked to broader metropolitan processes, including suburbanization and commuting-based residential mobility. In the Vienna–Bratislava metropolitan region, differences in housing costs, labor market opportunities and transport accessibility appear to create incentives for residential relocation and commuting across national borders. These factors contribute to the emergence of cross-border suburbanization, in which municipalities near national borders serve as residential hinterlands for metropolitan labor markets.
The principal component analysis further revealed that residential pressure can be interpreted as a multidimensional phenomenon composed of two interrelated dimensions. The first dimension captures the dynamic component of residential pressure associated with population growth, household formation, and commuting intensity, which are typical features of suburbanization. The second dimension reflects demographic and structural characteristics of municipalities related to household composition and population structure. Although these dimensions capture different aspects of residential processes, the results confirm that the selected indicators represent a coherent set.
Based on the PCA results, municipalities were classified into four types, each representing a different pattern of residential development. The typology highlighted dynamic suburban municipalities, commuting-oriented residential areas, municipalities experiencing demographic transformation, and stagnating municipalities with lower residential dynamics. The spatial distribution of these types was not random.
Overall, the findings indicate that residential pressure in Austrian municipalities is shaped not only by local demographic developments but also by broader spatial and functional relationships. In particular, municipalities located in border regions may experience specific forms of residential dynamics associated with cross-border mobility and metropolitan integration. The study, therefore, highlights the importance of considering cross-border functional regions when analyzing housing demand and residential development patterns.
From a methodological perspective, the study demonstrates the usefulness of composite indicators for analyzing complex residential processes at the local level. By integrating demographic and functional indicators into a single measure, the Residential Pressure Index provides a synthetic representation of residential dynamics that supports spatial analysis and regional comparisons. The approach developed in this study may therefore be applied in other metropolitan and cross-border regions where similar mobility patterns influence housing demand.
Future research could further explore the role of housing market conditions, commuting infrastructure and institutional differences between neighboring countries in shaping cross-border residential mobility. Such analyzes would contribute to a deeper understanding of how metropolitan integration and cross-border interactions influence housing demand and spatial development in European border regions.
Overall, the findings demonstrate that residential pressures in Austrian municipalities are not determined solely by local demographic dynamics but are increasingly shaped by spatial interactions and cross-border functional integration, particularly within the Vienna–Bratislava metropolitan region.