

India’s industrial sector drives production, employment, and innovation across primary, secondary, and tertiary sectors [1]. The rapid expansion of industrial areas has, however, significantly outpaced the development of adequate housing for the workers who sustain it, leading to severe housing shortages [2] and deteriorating living conditions [3]. This widening structural gap disproportionately burdens low-income migrant workers who lack the financial resources and social capital to access formal housing markets.
Noida – the New Okhla Industrial Development Authority city, is a city located in the Gautam Buddha Nagar district of Uttar Pradesh, India- exemplifies this crisis with particular acuity. Industrial workers constituted 29.47 percent of Noida’s urban workforce as early as 1991 [4], a proportion that has grown substantially with the city’s subsequent economic expansion. Housing provision has consistently failed to keep pace, producing proliferating informal settlements and deteriorating living conditions [5]. The contradiction between Noida’s selection for the United Nations Global Sustainable Cities 2025 Initiative in 2018 [6] and the documented housing conditions of its workers constitutes the central analytical tension of this study.
Existing research on urban housing in India has focused predominantly on slum rehabilitation and general low-income affordability [7, 8], without systematically addressing the specific circumstances of workers in designated industrial zones. Global studies on industrial worker housing – from Vietnam [9], Indonesia [3], and sub-Saharan Africa [10] – identify sustainability parameters spanning energy efficiency, workplace proximity, service access, and cultural responsiveness, but their applicability within India’s institutional and regulatory framework remains insufficiently examined. Prior context-specific work, such as the Sidoarjo case in Indonesia [11], underlines the necessity of locally calibrated assessment approaches. This study fills that gap. Three research questions structure the inquiry:
The study’s primary contribution is a twelve-indicator, Delphi-validated sustainability assessment framework applied through primary worker data, producing a dimensional performance scoring methodology and a directly linked policy recommendation set. Secondary contributions include a quantitative analysis of housing conditions across income groups, a cross-dimensional synthesis revealing the structural drivers of inadequacy, and a transferable assessment instrument for comparable industrial urban contexts.
Affordability is a paramount concern, with studies emphasizing the exclusion of low-income industrial workers from formal housing markets due to bureaucratic inefficiencies and high costs [7, 8]. The Ministry of Housing [12] defines affordable housing as requiring no more than 30 percent of gross household income — a threshold routinely exceeded by Economically Weaker Section (EWS) workers in Indian industrial cities. Documented worker preference for rental housing proximate to workplaces reflects income constraint and absent employer transport, making proximity a financial necessity rather than a discretionary preference; community-led rental models that integrate shared social infrastructure represent one promising response [13].
The environmental dimension of worker housing sustainability is critically underdeveloped in Indian industrial policy. The importance of eco-friendly materials and energy-efficient designs is acknowledged [14–16] but implementation is hampered by cost constraints and policy gaps. The potential of prefabricated and green solutions [17] remains under-researched for large-scale industrial housing in India. Carbon-intensive construction practices — burnt bricks and reinforced cement concrete — generate disproportionate lifecycle \(CO_2\) emissions [18, 19]. Lifecycle cost analysis [20] provides a methodology for demonstrating the comparative long-term affordability of well-designed formal housing, yet has not been applied systematically in Indian industrial housing policy.
Initiatives such as NITI Aayog’s SAFE Accommodation, MaS-SHIP, and the ARHC Scheme demonstrate growing recognition of the need for sustainable and affordable solutions [21–23]. Recent NCR developments including ‘New Noida’ reflect a shift towards integrated sustainable urban planning [24, 25]. International evidence is instructive: Vietnam’s statutory developer obligations and Singapore’s JTC Corporation regulated dormitory framework both demonstrate that mandatory cross-sectoral regulatory instruments substantially improve outcomes at scale [26, 27], suggesting a transferable institutional model for the Noida context.
Socio-economic inclusivity — access to essential services, sanitation, and gender-sensitive design — is frequently overlooked [28–30]. Housing that fails to accommodate the cultural practices and community life of diverse migrant populations generates adverse effects on mental health and social integration [31, 32]. Female workers face distinct vulnerabilities that gender-neutral design routinely neglects [33]. Despite this breadth of literature, a context-specific empirical analysis of Noida integrating a validated indicator framework with primary worker data remains absent [34]. This study addresses that gap.
Noida (New Okhla Industrial Development Authority) is located in Gautam Buddha Nagar district, Uttar Pradesh, within the NCR as a satellite city to Delhi. Established as a planned industrial township in 1976, it has grown into one of India’s foremost manufacturing centres. The 2011 Census recorded a population of 642,381; subsequent growth has substantially increased this figure [4]. The city’s industrial landscape is organized into three phases (phase-1, phase-2, phase-3) hosting 235 medium and large enterprises and 3,587 small-scale units across ten sectors (Figure 1; Figure 2).
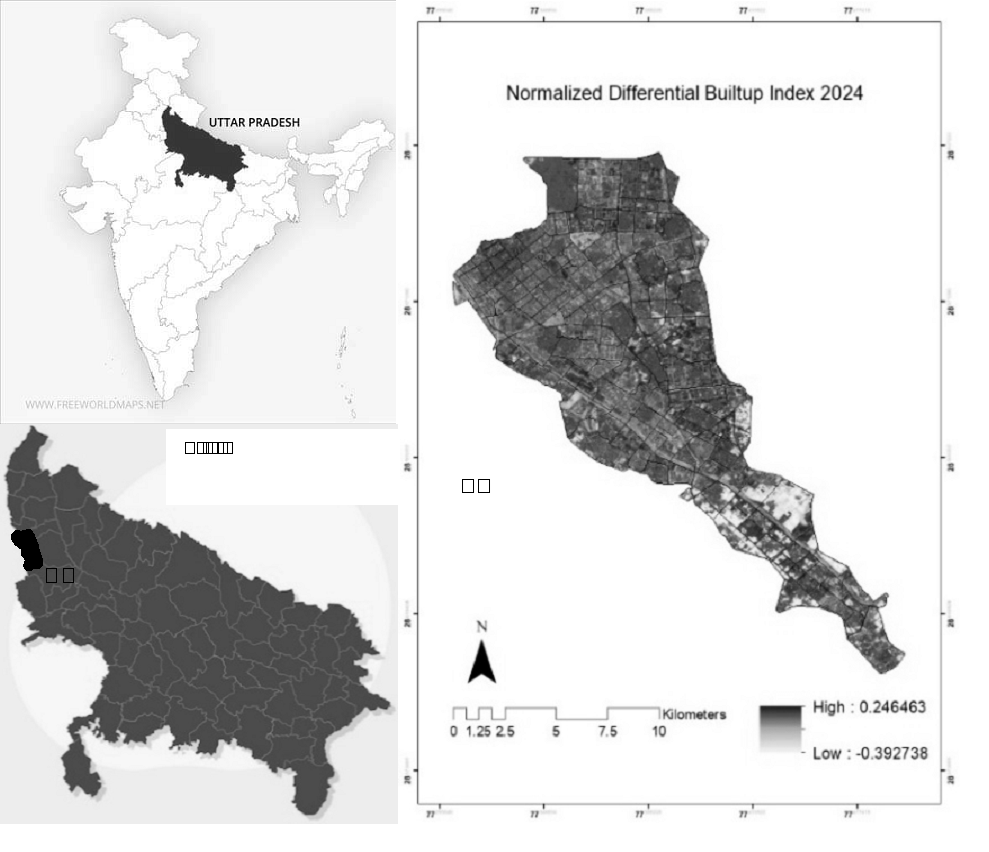
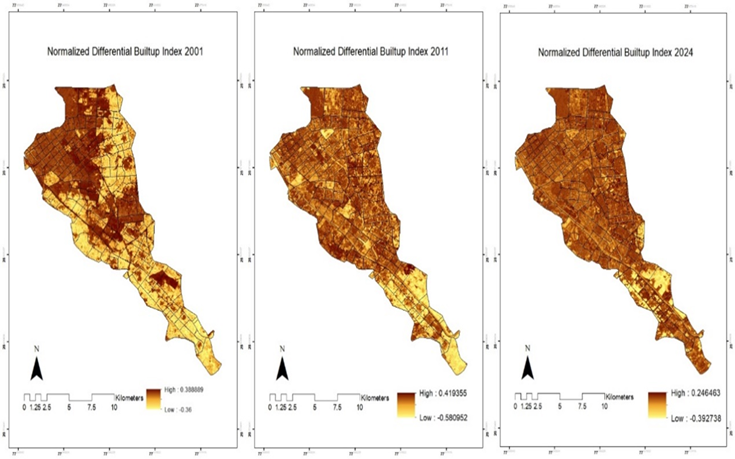
Despite this scale of employment, dedicated worker housing provision within or adjacent to industrial zones is negligible. Workers are absorbed into informal housing markets of neighbouring unauthorized colonies and urban villages — including Harola, Salarpur, and Sadarpur colony — where proximity to industrial phases drives rental demand and above-market pricing relative to housing quality [35]. Addressing sustainable housing and efficient land use in Noida is increasingly critical for its long-term urban development trajectory [36]. It is precisely this contradiction between Noida’s formal planning ambition and the informal housing reality of its workers that makes it a theoretically significant case study.
An explanatory sequential mixed-methods design was adopted (Figure 3). Phase 1 established a validated indicator framework through a systematic literature review and three-round expert Delphi survey. Phase 2 operationalized the validated indicators as structured questionnaire items deployed through worker interviews. This sequential architecture ensures that worker-level data collection instruments are grounded in expert-validated, context-calibrated criteria rather than in assumptions imported from dissimilar international frameworks.
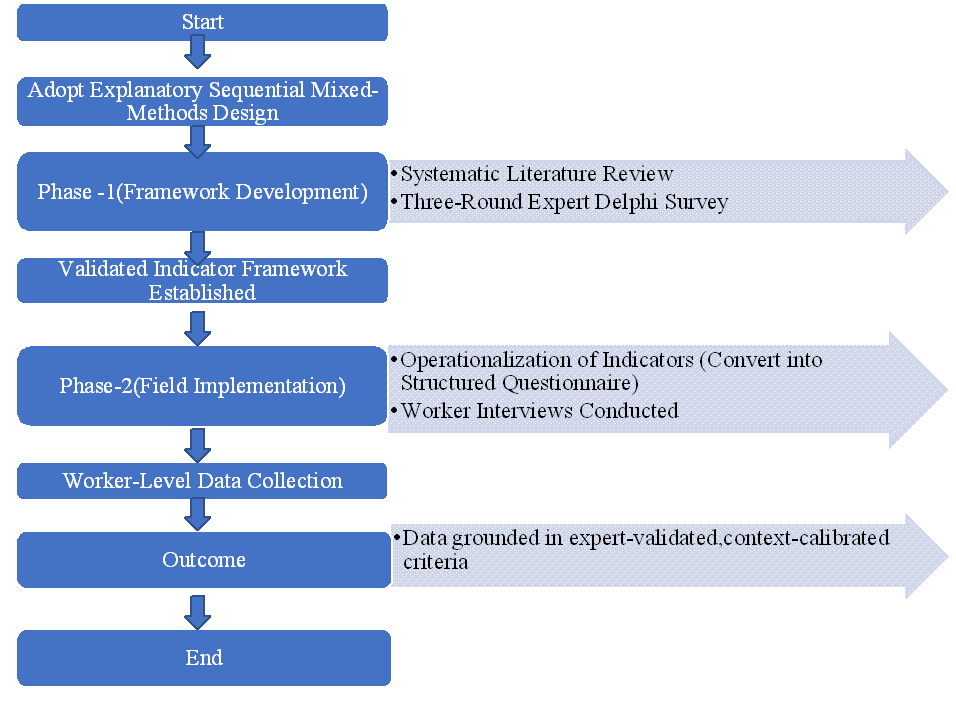
The framework was grounded in the UN-Habitat four-dimensional model of sustainable housing — social, economic, environmental, and cultural [34]. A systematic literature review was conducted using Scopus, ScienceDirect, Web of Science, and Google Scholar. Eighteen candidate indicators were identified across the four dimensions (Table 1).
| Dimension | Indicator | Key References |
|---|---|---|
| Social | 1. Community empowerment and participation | [10, 34, 37–44] |
| 2. Quality of housing | [10, 34, 37, 38, 40–42, 44–53] | |
| 3. Sense of place | [34, 37, 45, 47] | |
| 4. Housing preferences | [10, 37, 41, 46, 47, 53] | |
| Economic | 5. Employment opportunities | [10, 34, 46, 49] |
| 6. Affordability | [10, 34, 49, 50] | |
| 7. Financial assistance | [34, 49] | |
| 8. Maintenance and management | [34, 49] | |
| 9. Job security | [34, 49] | |
| 10. Local economic development | [10, 34, 49] | |
| 11. Life cycle cost assessment | [53] | |
| Environmental | 12. Sustainable local construction and materials | [34, 49, 54] |
| 13. Energy, water, and resource efficiency | [34, 38, 42, 49, 51, 54] | |
| 14. Disaster-resistant design and planning | [34, 42] | |
| Cultural | 15. Culturally responsive housing design | [10, 16, 31, 34, 47] |
| 16. Diversity and cultural inclusivity | [16] | |
| 17. Transition: informal to formal housing | [34] | |
| 18. Promotion of local craftsmanship | [34] |
A three-round Delphi survey was administered to a purposively composed panel of 35 experts with professional expertise in sustainable housing, urban planning, and industrial development in the NCR context. Panel composition: architects (n = 10, 28.6%), housing planners (n = 12, 34.3%), urban planners (n = 6, 17.1%), industrialists (n = 3, 8.6%), private developers (n = 2, 5.7%), and government policymakers (n = 2, 5.7%). This composition ensured representational balance across technical, practitioner, and institutional perspectives, reducing the risk of consensus skew toward any single viewpoint.
In Round 1, each candidate indicator was rated on a five-point Likert scale across three criteria: relevance to the Noida context (R), measurability through worker-level survey (M), and conceptual distinctiveness (D). The consensus score (CS) was calculated as: CS (%) = (\(\Sigma\) ratings \(\geq\) 4 / N) \(\times\) 100. Round 2 returned anonymized group medians with interquartile ranges; participants revised ratings with written justifications for deviations exceeding 1.0 point from the group median. Round 3 achieved final convergence, with retention defined at CS \(\geq\) 70 percent. Twelve indicators were retained; six were excluded — employment opportunities (CS = 68.6%), job security (65.7%), maintenance and management (62.9%), diversity and cultural inclusivity (60.0%), housing transition (57.1%), and local craftsmanship (54.3%) – due to inter-item redundancy or insufficient measurability. Final indicators and their consensus scores are presented in Table 2.
| Dimension | Code | Validated Indicator | Consensus Score (%) |
|---|---|---|---|
| Social (A) | A1 | Community empowerment and public participation | 85.7 |
| A2 | Quality of housing | 91.4 | |
| A3 | Housing preferences | 82.9 | |
| A4 | Sense of place | 77.1 | |
| Cultural (B) | B1 | Culturally responsive settlements and design | 72.3 |
| Economic (C) | C1 | Affordability | 93.7 |
| C2 | Financial assistance | 88.6 | |
| C3 | Local economic development | 80.0 | |
| C4 | Lifecycle cost assessment | 70.9 | |
| Environmental (D) | D1 | Sustainable local construction materials | 85.7 |
| D2 | Energy, water, and resource efficiency | 88.6 | |
| D3 | Disaster-resistant design and planning | 82.9 |
Note. Minimum retention threshold = CS \(\geq\) 70.0%: employment opportunities (68.6%), job security (65.7%), maintenance and management (62.9%), diversity and cultural inclusivity (60.0%), housing transition (57.1%), local craftsmanship (54.3%). Each retained indicator was operationalized as 2–4 measurable sub-items in the worker questionnaire.
Each validated indicator was operationalized as two to four measurable sub-items rated on a three-point scale (0 = very inadequate, 1 = inadequate, 2 = adequate). For example, indicator C1 (Affordability) was measured through: (a) monthly household income band; (b) current monthly rent; (c) calculated rent-to-income ratio; and (d) self-reported financial strain rating. Indicator A2 (Quality of housing) was assessed via seven sub-items addressing structural durability, overcrowding density, sanitation adequacy, tenure security, location, safety, and infrastructure access. Indicator B1 (Culturally responsive design) was measured through availability of communal gathering spaces, alignment with cultural practices, and presence of shared outdoor areas. Sub-item scores were aggregated and normalized: Indicator Score = (\(\Sigma\) sub-item ratings / Maximum possible sub-item score) \(\times\) 100. Dimension scores represent arithmetic means of their constituent indicator scores.
Structured interviews were conducted between February and March 2021 across Noida’s three industrial phases (Phase I: 30%; Phase II: 30%; Phase III: 40%). COVID-19 restrictions precluded random probability sampling; a snowball non-probability technique was employed. Of 109 total interviews, 90 were conducted face-to-face and 19 by telephone. The instrument was piloted with 30 workers prior to full deployment, with feedback leading to reformulation of technical items in Hindi and simplification of two Likert response formats. Data collection used four channels: industry visits; public spaces during lunch breaks; home visits arranged through referrals; and telephone interviews. The sample was 89 percent male and 11 percent female, broadly reflecting the gender composition of Noida’s formal industrial workforce, but limiting insight into female workers’ distinct housing needs — a gap explicitly acknowledged for future research.
Snowball sampling carries acknowledged methodological limitations: it introduces potential homophily bias, may under-represent precarious workers and female employees, and constrains formal statistical generalizability. The findings should therefore be interpreted as exploratory and context-specific rather than representative of Noida’s full industrial workforce. Future studies using stratified random sampling across industrial sectors and genders would substantially strengthen the evidential base.
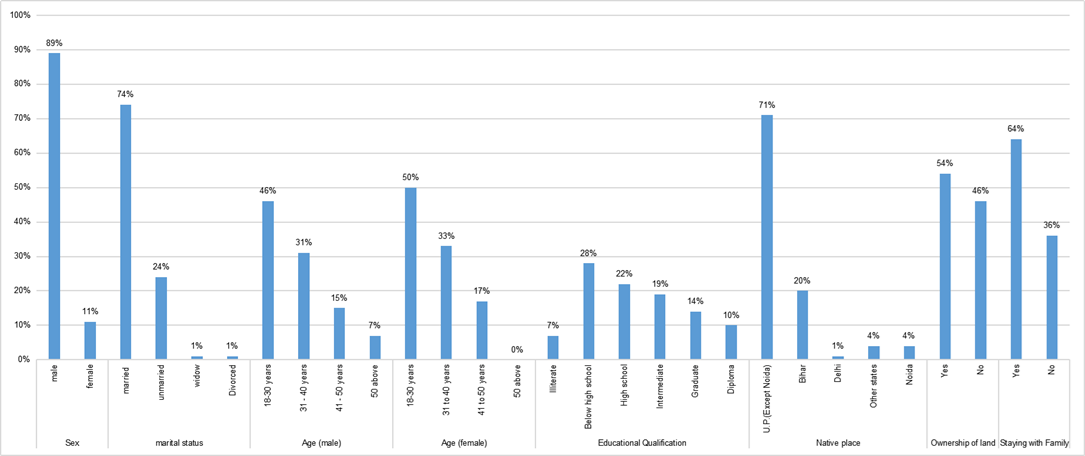
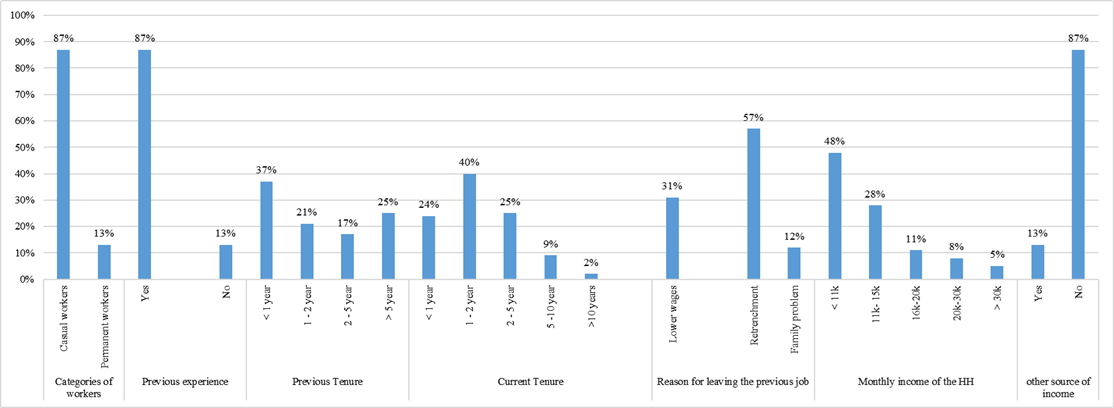
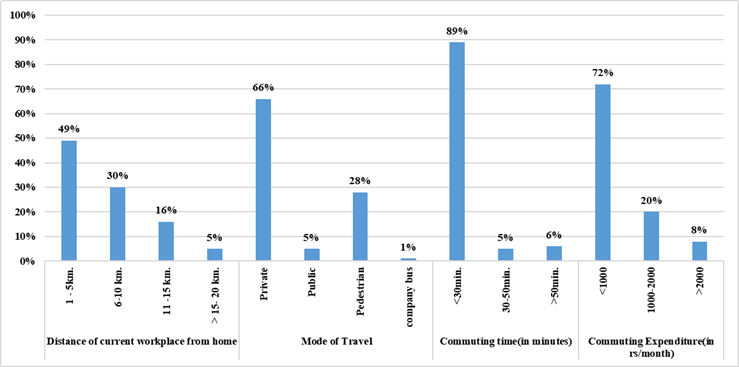
Figures 4–7 outline the socio-demographic, economic, commuting, and housing characteristics of the 109 respondents.
Socio-demographic profile (Figure 4): A significant share (77%) are young migrants aged 18–40 from rural Uttar Pradesh, predominantly male, underscoring the gender imbalance in Noida’s industrial workforce. Most (74%) are married, and 64% live with dependent family members, creating demand for family-oriented housing that the informal rental market fails to meet. Educational attainment is modest: 41.0% completed secondary schooling, while 28% remain below that level.
Economic profile (Figure 5): The workforce is highly precarious, with 87% engaged as casual workers and an equal proportion lacking secondary income sources. Retrenchment is the leading cause of job loss (57%), followed by low wages (31%). Tenure is short, with 40% reporting only 1–2 years in their current role. Compared to national data—where 22–23% of workers are casual and 90% are informally employed—the sample is more vulnerable, combining insecure work, low wages, and limited financial resilience. Median earnings hover around ₹10,000 or less, with nearly half of Indian workers below minimum wage benchmarks, situating this group at the lower end of the labour market.
Commuting profile (Figure 6): Nearly half (49%) live within 1–5 km of their workplace, reflecting cost and accessibility constraints. Private transport dominates (66%), while public transport use is minimal (5%), suggesting limited reliability or availability. Walking accounts for 28%, reinforcing the short-distance pattern. Travel times are generally low, with 89% commuting under 30 minutes. Despite proximity, costs remain burdensome: 28% spend more than ₹1000 monthly, highlighting sensitivity among low-income households.
Housing profile (Figure 7): Most workers (83%) reside in rented accommodation, concentrated in urban villages (52%) and unauthorized colonies (43%), pointing to reliance on informal housing. Rent levels are moderate, with 49% paying ₹2.5k–3.5k. Housing units are compact: 49% live in single rooms with shared facilities, while 36% occupy units with attached kitchens and baths.
The respondents represent a young, male-dominated migrant workforce, heavily concentrated in casual employment, with short job tenures, low wages, and minimal financial buffers. Their housing and commuting choices reflect economic vulnerability, reliance on informal markets, and cost-driven proximity to workplaces, reinforcing the precariousness of their livelihoods.
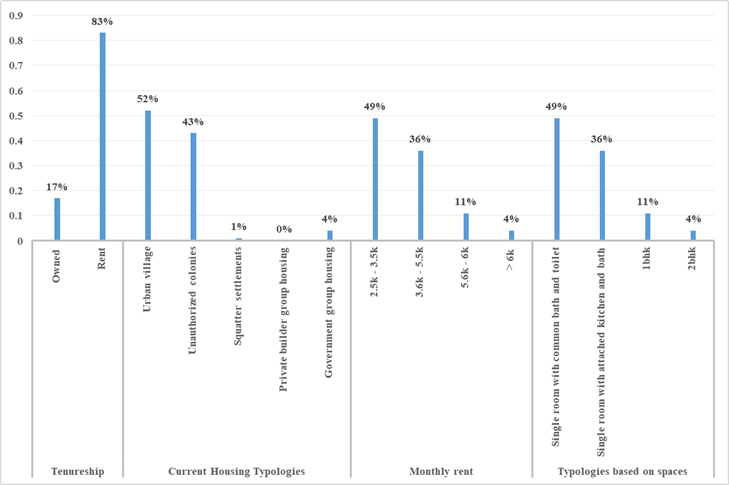
Table 3 presents affordability results disaggregated by income band, benchmarked against the Ministry of Housing [12] threshold of 30 percent. Workers in the lowest income band (\(\leq\) ₹11,000/month; n = 38; 34.9% of sample) pay a mean rent of ₹3,500, yielding a rent-to-income ratio of 31.8 percent — 1.8 percentage points above the threshold. Workers in the middle band (₹11,001–₹15,000; n = 46; 42.2%) face the most acute affordability pressure, with a ratio of 42.3 percent — 12.3 percentage points above threshold — and average post-rent income of approximately ₹7,500 per month for all other expenditures. The upper band (₹16,001–₹20,000; n = 25; 22.9%) reaches a mean ratio of 33.3 percent, leaving no buffer for utilities, maintenance, or relocation costs. The weighted sample mean of 36.4 percent confirms that informal market rents are structurally unaffordable across the full EWS income spectrum.
| Income Band (₹/month) | n (%) | Accommodation Type | Mean Rent (₹) | Rent/Income (%) | Excess (pp) |
|---|---|---|---|---|---|
| \(\leq\) 11,000 | 38 (34.9) | Single room; shared bath and toilet | 3,500 | 31.8 | +1.8 |
| 11,001–15,000 | 46 (42.2) | Single room; attached kitchen and bath | 5,500 | 42.3 \(\blacktriangle\) | +12.3 |
| 16,001–20,000 | 25 (22.9) | 1 BHK or 2 rooms with kitchen and bath | 6,000 | 33.3 | +3.3 |
| Weighted mean | 109 (100) | — | 4,891 | 36.4 | All exceed |
Note. Ratios calculated at band midpoints (₹9,000; ₹13,000; ₹18,000). \(\blacktriangle\) = most severely unaffordable cohort. pp = percentage points.
Table 4 presents the normalized indicator and dimension scores. The aggregate sustainability performance score of 33.2 out of 100 confirms systemic inadequacy: no dimension exceeds 40, and the cultural dimension scores lowest (28.7), followed by economic (31.6), social (34.2), and environmental (38.4). The weakest individual indicator is financial assistance (C2 = 12.4), reflecting 94.5 percent of respondents receiving zero employer housing support. Table 5 income-quality cross-tabulation reveals a significant gradient: the lowest band scores 22.6 on housing quality, rising to 29.8 (middle band) and 40.7 (upper band) — yet absolute scores remain low across all groups, confirming that income improvements within the EWS range alone are insufficient. Supply-side regulatory failure and employer welfare exclusion are the binding constraints.
| Dimension | Code | Indicator | Score (/100) | Dim. Mean |
|---|---|---|---|---|
| Social (A) | A1 | Community empowerment and participation | 21.3 | 34.2 |
| A2 | Quality of housing | 29.8 | ||
| A3 | Housing preferences | 51.7 | ||
| A4 | Sense of place | 33.8 | ||
| Cultural (B) | B1 | Culturally responsive design | 28.7 \(\blacktriangledown\) | 28.7 \(\blacktriangledown\) |
| Economic (C) | C1 | Affordability | 26.2 | 31.6 |
| C2 | Financial assistance | 12.4 \(\blacktriangledown\)\(\blacktriangledown\) | ||
| C3 | Local economic development | 33.1 | ||
| C4 | Lifecycle cost assessment | 54.7 | ||
| Environmental (D) | D1 | Sustainable construction materials | 29.6 | 38.4 |
| D2 | Energy, water, resource efficiency | 42.1 | ||
| D3 | Disaster-resistant design and planning | 43.4 | ||
| Aggregate | — | Mean across all twelve indicators | — | 33.2 |
Note. \(\blacktriangledown\) = lowest-scoring dimension (Cultural, 28.7). \(\blacktriangledown\)\(\blacktriangledown\) = lowest-scoring indicator (C2 Financial assistance, 12.4).
The aggregate score of 33.2 and the dimensional analysis confirm that Noida’s industrial worker housing crisis is systemic rather than concentrated in any single parameter. The dominant structural driver is labour casualization: with 82.6 percent of respondents engaged as casual labourers, they are simultaneously excluded from housing rent allowances, employer provident fund contributions, and government housing scheme eligibility. This employment-status variable operates as a structural multiplier — depressing income, eliminating formal welfare entitlements, generating residential instability, and concentrating workers in informal settlements where cultural and environmental standards are unregulated. This finding extends [7, 8] on Indian urban housing exclusion by adding quantified specificity: the 94.5 percent rate of zero employer support and 87.2 percent single-income dependency translate directly into the affordability ratios, quality deficits, and cultural displacement documented in the dimensional analysis.
| Dimension | Code | Indicator | Band 1 \(\leq\) ₹11,000 n=38 | Band 2 ₹11,001-15,000 n=46 | Band 3 ₹16,001-20,000 n=25 | Full Sample |
|---|---|---|---|---|---|---|
| Social (A) | A1 | Community empowerment | 16.1 | 21.3 | 29.2 | 21.3 |
| A2 | Quality of housing † | 22.6 | 29.8 | 40.7 | 29.8 | |
| A3 | Housing preferences | 45.9 | 51.7 | 60.5 | 51.7 | |
| A4 | Sense of place | 29.4 | 33.8 | 40.5 | 33.8 | |
| Cultural (B) | B1 | Culturally responsive design | 26.1 | 28.7 | 32.7 | 28.7 |
| Economic (C) | C1 | Affordability | 19.4 | 26.2 | 36.5 | 26.2 |
| C2 | Financial assistance ‡ | 10.2 | 12.4 | 15.7 | 12.4 | |
| C3 | Local economic development | 26.7 | 33.1 | 42.8 | 33.1 | |
| C4 | Lifecycle cost assessment | 48.9 | 54.7 | 63.5 | 54.7 | |
| Environmental (D) | D1 | Sustainable construction materials | 27.2 | 29.6 | 33.2 | 29.6 |
| D2 | Energy, water, resource efficiency | 39.1 | 42.1 | 46.7 | 42.1 | |
| D3 | Disaster-resistant design | 40.2 | 43.4 | 48.3 | 43.4 | |
| Social (A) — Dimension Mean | 28.5 | 34.2 | 42.7 | 34.2 | ||
| Cultural (B) — Dimension Mean | 26.1 | 28.7 | 32.7 | 28.7 | ||
| Economic (C) — Dimension Mean | 26.3 | 31.6 | 39.6 | 31.6 | ||
| Environmental (D) — Dimension Mean | 35.5 | 38.4 | 42.7 | 38.4 | ||
| Composite Sustainability Score | 29.1 | 33.2 | 39.4 | 33.2 | ||
Income band midpoints used for rent-to-income calculations (₹9,000; ₹13,000; ₹18,000). Band-level indicator scores calculated from sub-item Likert responses and normalized to 0–100 using the formula: Score = (\(\Sigma\) sub-item ratings / Maximum possible sub-item score) \(\times\) 100, consistent with the operationalization described in Section 4.4. Dimension means are arithmetic means of constituent indicator scores. Weighted means across income bands reproduce the full-sample scores reported in Table 4 (weights: Band 1 = 0.349; Band 2 = 0.422; Band 3 = 0.229).
Comparison with international industrial housing contexts where institutional interventions have produced more favourable outcomes is instructive. In Hanoi’s industrial zones, [9, 26] document similar affordability deficits but note that Vietnam’s statutory developer obligations — mandating land reservation within industrial parks for worker accommodation — create a legally enforceable supply mechanism absent from India. In Surabaya, [3] found strong worker preferences for factory-proximate housing, paralleling Noida’s findings, but Indonesian workers benefit from subsidized state worker flats unavailable here. Singapore’s JTC framework [27] demonstrates that regulated dormitory provision with enforceable habitability and community facility standards substantially improves outcomes — an institutional model structurally applicable to Noida, where the Noida Development Authority, Ministry of Housing, and industrial associations already represent the actors required for comparable cross-sectoral coordination. Compared to sub-Saharan African industrial housing contexts [10, 42], Noida’s institutional capacity is substantially greater, confirming that the primary constraint is a specific regulatory instrument, not institutional absence [55]. Collaborative efforts between government, private developers, and communities are essential [56]. Worker housing is a documented enabler of large-scale manufacturing competitiveness [57], strengthening the economic case for policy action.
The cultural dimension score of 28.7 — the lowest across all four dimensions — provides quantitative support for [31] theoretical argument that socio-cultural sustainability is measurable and materially consequential, and for [32] cross-cultural evidence that housing failing to accommodate social and religious practices generates adverse effects on mental well-being and community cohesion. That 83.5 percent of respondents reported absent community gathering spaces confirms that culturally responsive design is a primary driver of housing inadequacy — not an optional enhancement. This finding constitutes the most distinctive planning contribution of the present study: establishing cultural responsiveness as a first-order sustainability parameter in the design of industrial worker housing in diverse, migrant-populated cities [58], comparable to the role identified by [32] in Jordanian housing context.
This study’s primary contribution is planning-based and methodological. The twelve-indicator Delphi-validated framework with dimensional performance scoring provides a more contextually specific and operationally precise assessment instrument for industrial worker housing than the general-purpose frameworks currently available [34, 49]. The normalized 0–100 scoring methodology enables cross-case comparison and longitudinal performance tracking in ways that descriptive assessments do not. The explicit linkage between indicator scores and the recommendations in Table 6 creates a direct evidence-to-action pathway absent from prior Indian industrial housing research. The framework is transferable to comparable industrial urban contexts in the Global South, contributing a practical planning assessment tool aligned with SDG 11 objectives for sustainable cities and communities.
This study assessed the viability of twelve validated sustainability parameters for industrial worker housing in Noida, India. The aggregate sustainability performance score of 33.2 out of 100, derived from primary data from 109 workers, confirms systemic inadequacy across all four UN-Habitat dimensions. Affordability analysis demonstrates rent-to-income ratios exceeding the Ministry of Housing [12] threshold across all EWS income groups, reaching 42.3 percent in the most severely constrained cohort. The near-universal absence of employer financial support (94.5%) and single-income dependence (87.2%) function as structural multipliers cascading across social, cultural, and environmental dimensions. The cultural dimension scores lowest (28.7), identifying culturally responsive design as the most neglected sustainability axis — a finding with distinctive planning significance.
The study’s principal methodological contribution is a validated, operationalized, and transferable sustainability indicator framework with a dimensional performance scoring system enabling systematic cross-case comparison. Its applied contribution is the set of four evidence-calibrated recommendations in Table 6. Despite limitations imposed by snowball sampling, cross-sectional data collection, and underrepresentation of female workers, the research establishes a replicable baseline for future studies and a directly actionable planning framework for Noida’s industrial housing governance.
Table 6 presents four categories of institutional recommendation directly calibrated to the dimensional performance deficits measured in Section 5. Each recommendation is tied to its specific measured deficit and responsible actor, addressing the reviewer’s concern that recommendations remain connected to empirical findings.
| Dimension (Score) | Key Deficit | Evidence Basis | Recommendation, Actor, and Reference |
|---|---|---|---|
| Social (34.2) | Participation: 21.3; 91.7% unaware of PMAY/ARHC | Structural exclusion from planning; low scheme awareness | Establish ward-level housing outreach cells with multilingual materials. Mandate worker representation on NOIDA housing planning committees [1]. |
| Quality: 29.8; sanitation sub-score 18.4% | Overcrowding, structural deficiency, inadequate sanitation | Introduce mandatory Habitability Standards Certificate for rental units within 1.5 km of industrial zones: one toilet per four occupants; structural durability certification; minimum 4.5 sqm per person [2]. | |
| Cultural (28.7) \(\blacktriangledown\) | Absent community spaces (83.5%); non-responsive design (71.6%) | Uniform housing; diverse migrant workforce; cultural needs unaddressed | Adopt Cultural Responsiveness Design Checklist for all new industrial-zone residential approvals: shared courtyard \(\geq\) 2 sqm per unit; multi-purpose community room per 50 units [31, 32]. |
| Economic (31.6) | Affordability: 26.2; weighted ratio 36.4%; all EWS groups exceed 30% | Market failure; insufficient formal rental supply at EWS-compatible rents | Introduce Affordable Industrial Worker Rental Housing (AIWRH) scheme capping rents at 25% of EWS income threshold. Offer Floor Area Ratio bonuses and 25% property tax relief to compliant developers [9]. |
| Financial assistance: 12.4 \(\blacktriangledown\)\(\blacktriangledown\); 94.5% receive zero employer support | Casual employment status excludes workers from all employer welfare entitlements | Mandate housing allowance of 10% of basic wage for all workers engaged \(\geq\) 90 continuous days, irrespective of employment classification (International Labour Office, 2008). | |
| Environmental (38.4) | Materials: 29.6; 78.9% burnt brick/RCC; zero sustainable alternatives | High-carbon informal construction; absent sustainable material supply chains | Establish subsidized Sustainable Materials Procurement Facility from industrial waste streams. Enforce National Building Code seismic Zone IV provisions through phased retrofitting programme (NBC, 2016). |
| Resource efficiency: 42.1; groundwater depletion; no waste segregation | No recharge infrastructure; improper solid waste disposal | Mandate rainwater harvesting and grey-water recycling in new industrial residential developments. Implement solid waste segregation programme for worker housing areas (World Business Council for Sustainable Development, 2012). |
Note. NOIDA = New Okhla Industrial Development Authority; FAR = Floor Area Ratio; PMAY = Pradhan Mantri Awas Yojana; ARHC = Affordable Rental Housing Complex
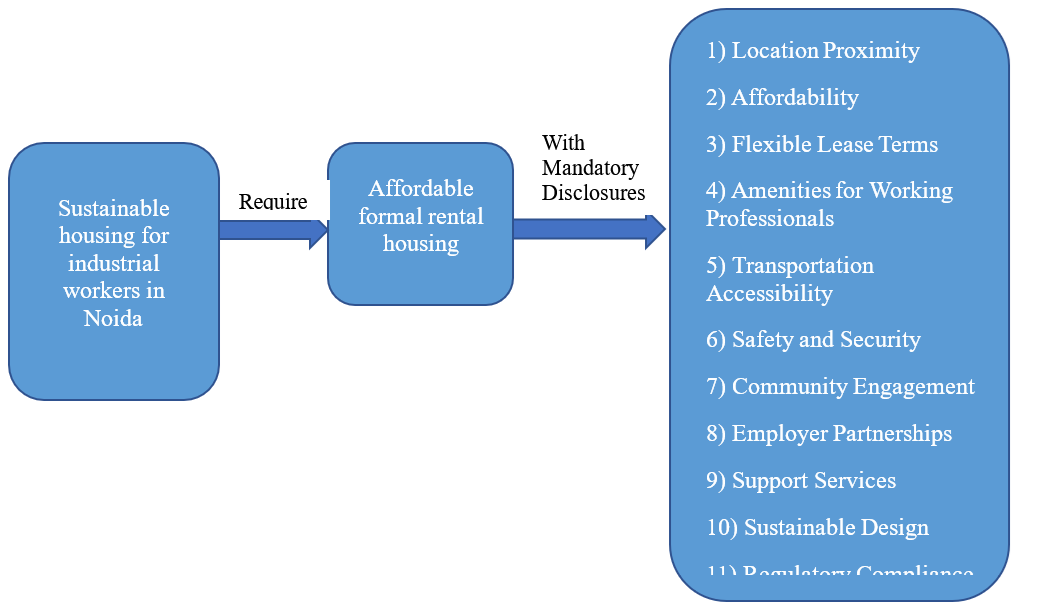
Integrated planning framework for sustainable industrial worker housing in Noida is presented in Figure 8.
Three priorities are identified for future research. First, stratified random sampling across industrial sectors and female workers would substantially improve representativeness and enable robust gendered housing analysis. Second, GIS-integrated spatial analysis of housing quality distributions relative to industrial zone boundaries would strengthen the planning applicability of the framework. Third, longitudinal data collection tracking housing condition changes in response to policy interventions would enable impact assessment of the recommended measures. Noida possesses the institutional capacity and development momentum to become a model for sustainable industrial worker housing within India’s expanding industrial corridor system [57]. The framework produced here provides the empirical baseline and planning instrument to begin that process systematically, in alignment with Sustainable Development Goal 11 [59].
The authors gratefully acknowledge the support provided by the National Institute of Technology, Hamirpur, Himachal Pradesh, India. Thanks are due to field assistants who supported primary data collection under challenging pandemic conditions, and to all industrial workers who participated in the survey. No external funding was received for this study.
Both authors contributed equally to conceptualization, research design, analysis, and writing. Fieldwork was conducted by the first author; manuscript review and refinement were jointly undertaken. Both authors approved the final version.
No potential conflict of interest is reported by the authors.
Primary data collected through structured field surveys in Noida, February–March 2021. Raw data cannot be publicly shared; anonymized summary datasets are available from the corresponding author upon reasonable request.
No generative AI tools were used in research design, data collection, analysis, or interpretation. AI-assisted tools were used solely for language editing; all substantive content and conclusions are the authors’ own.